PHP frameworks: Integrate support for New Relic
This document is aimed at the developers or maintainers of PHP frameworks. It suggests ways to extend your framework by adding support for New Relic. The PHP agent supports frameworks by figuring out where in the framework code web transactions can be appropriately named, and naming web transactions based on information found in the class, function call, etc. This solution is fragile and subject to the developers altering their code. New Relic encourages framework developers to put in the few calls needed to improve the out-of-box user experience with the framework they maintain.
New Relic can identify the web transaction name and where to insert JavaScript headers and footers for New Relic’s browser monitoring. However, to improve end users’ experience, increase performance, and make code maintenance easier, framework developers should do this work themselves. It is up to the developers of the various frameworks to decide if they want to help their users by adding native support for New Relic. In almost all cases adding support for New Relic involves inserting three API calls somewhere in the framework code.
In order to understand how to best add support for New Relic, it is useful to understand some of the key points of interaction.
| Term | Definition |
|---|---|
| Web transactions | Web transactions are asset requests (or user hits) to your site. With frameworks, this is often handled by an MVC dispatching mechanism. |
| Metrics | Metrics are named entities that report timing information. New Relic uses these metrics to generate charts and pages, such as the APM Summary page. For example, New Relic instruments calls to MySQL and generate metrics called Database/select or Database/update whenever a user selects or updates data. Metrics only contain timing data. |
| Transaction traces | During every harvest period, New Relic records the slowest web transaction that falls below a user-defined threshold. This is a transaction trace. It has more detail than simple metrics. If enabled, it will include a detailed call graph of exactly what functions were called and how long they took. For slow query statements, it obfuscates all data in the call. |
Important
Do not use brackets [suffix] at the end of your transaction name. New Relic automatically strips brackets from the name. Instead, use parentheses (suffix) or other symbols if needed.
Examples: If you have a blog-style framework, you would name the various transactions based on the user activity: display , edit , login , etc. If you use an MVC architecture, then an appropriate naming convention is controller/action . Do not include any request-specific data in the transaction name. For example, using the actual request URL leads to metric grouping issues.
| Platform | Transaction naming example |
|---|---|
| Drupal 7 | The dispatching is done in menu_execute_active_handler() . This calls call_user_func_array() , with the first argument being the name of the action. That is what to set as the web transaction name. |
| CakePHP 1.3 | CakePHP has a Dispatcher class with an _invoke method. This calls the appropriate controller class with a given action, and the transaction is named controller/action where controller is the name of the controller class. |
At the point where you want to route code to a specific controller and action (if you are using MVC) or to an action (if you are not using MVC), insert code similar to this: Controller and action (when using MVC):
if (extension_loaded ('newrelic')) newrelic_name_transaction ($controller . '/' . $action); >What is new relic php
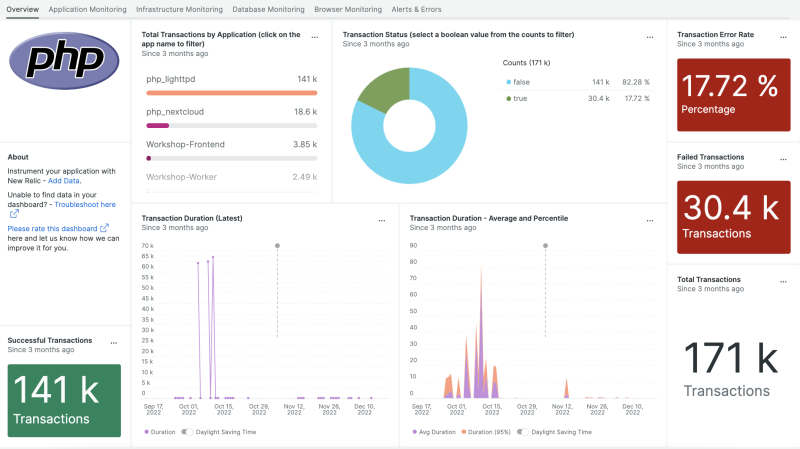
New Relic’s instant observability quickstart with a PHP server monitor agent helps app developers quickly identify and resolve errors, including slow responses, to enhance customer experiences.

What’s included?
PHP quickstart contains 1 dashboard. These interactive visualizations let you easily explore your data, understand context, and resolve problems faster.


PHP observability quickstart contains 3 alerts. These alerts detect changes in key performance metrics. Integrate these alerts with your favorite tools (like Slack, PagerDuty, etc.) and New Relic will let you know when something needs your attention.
This alert is triggered when the total duration of the web transaction is longer than 10 seconds during 5 minutes
This alert is triggered when the error percentage of web transactions is higher than 5% during 5 minutes
PHP observability quickstart contains 1 documentation reference. This is how you’ll get your data into New Relic.
PHP server monitoring
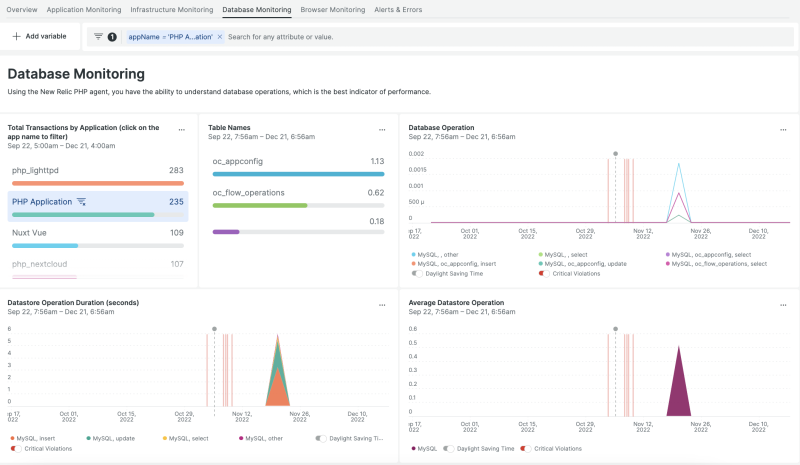
Use our PHP monitoring agent to see a high-level summary of their app performance in a comprehensive PHP dashboard. Help teams monitor the app’s Apdex, build architectural maps, and find and resolve errors quickly.
Our PHP agent collects and analyzes application data that drive data-driven decisions. Organize data, query data using NRQL, and visualize data (in customizable interactive dashboards) that directly impact customer experiences.
Real-time PHP metric monitoring
Identify slow AJAX request performance issues at a glance through our PHP dashboard that boasts broader visibility. Proactively monitor where you should concentrate your efforts and address potential errors quickly.
What’s included?
Our PHP quickstart include out-of-the-box dashboards and alerts, including:
- Alerts including error rates, duration, and throughput
- Multiple ready-to-use dashboards including throughput, error rate percentage, transaction time in milliseconds, and latest transactions
Discover the value of our PHP quickstart
New Relic’s instant observability quickstart helps developers leverage broader visibility in a PHP dashboard to resolve errors and speed up processes that enhance customer experiences.
How to use this quickstart
- Sign Up for a free New Relic account or Log In to your existing account.
- Click the install button.
- Install the quickstart to get started or improve how you monitor your environment. They’re filled with pre-built resources like dashboards, instrumentation, and alerts.
Introduction to New Relic for PHP
Our PHP agent monitors your application to help you identify and solve performance issues. You can also extend the agent’s performance monitoring to collect and analyze business data to help you improve the customer experience and make data-driven business decisions. Use the New Relic PHP agent to solve your app’s performance issues with our My app is slow tutorial.
one.newrelic.com
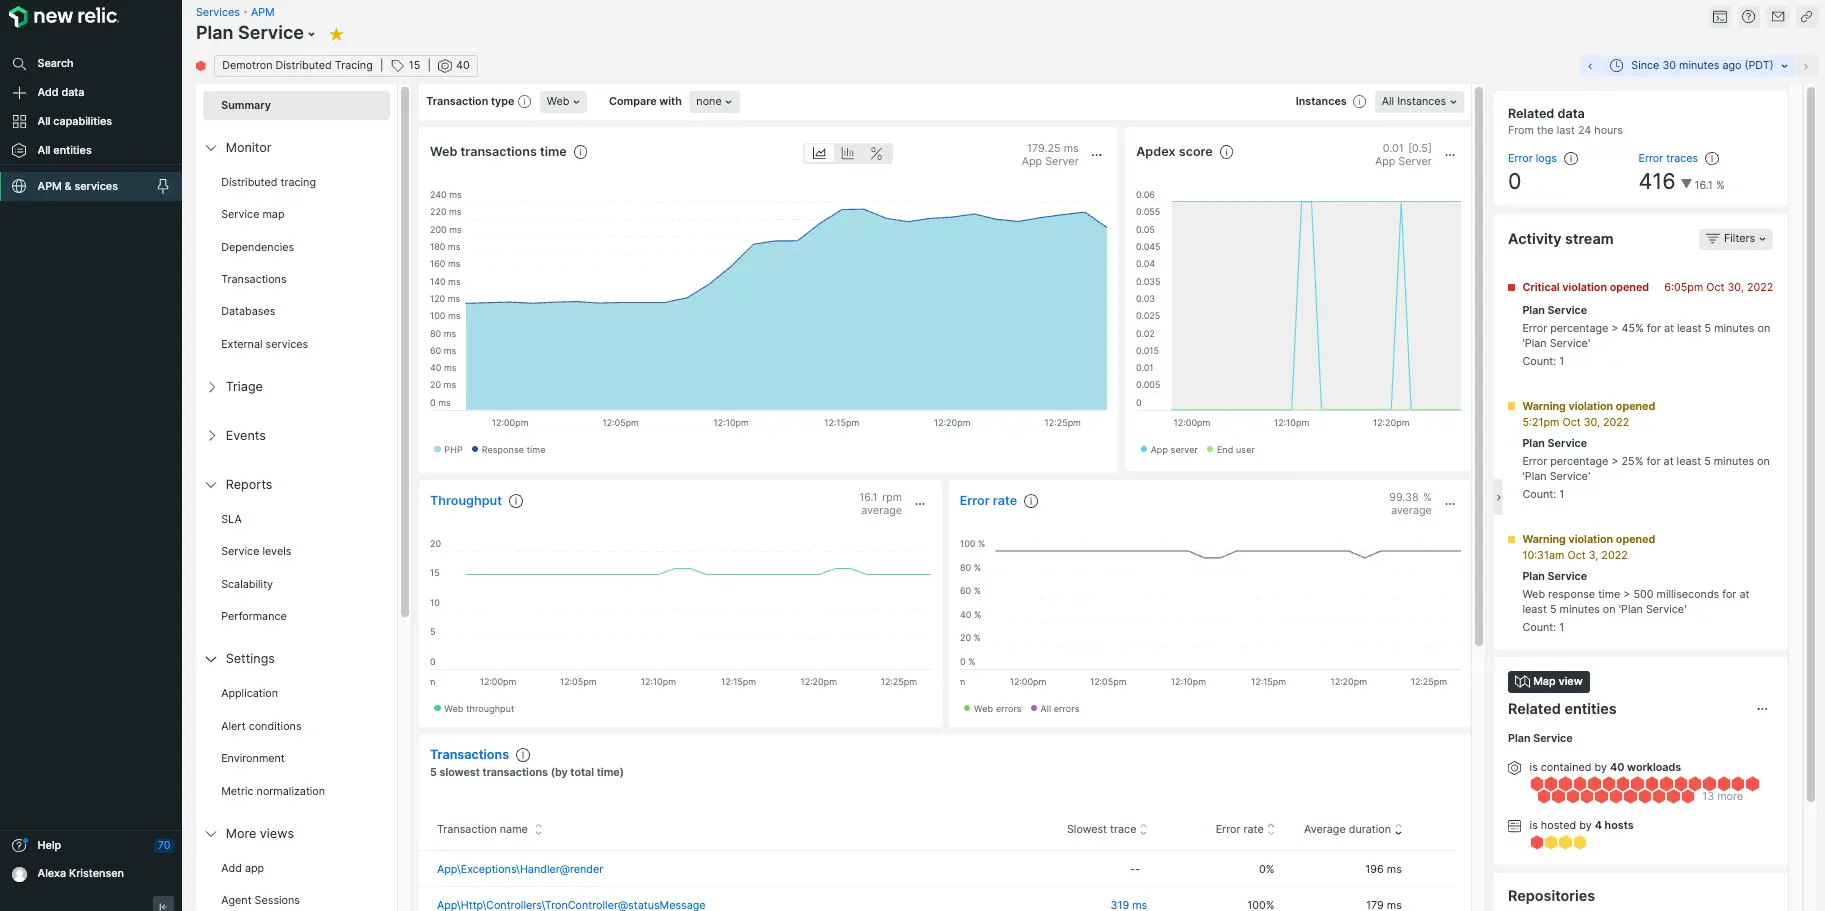
Find errors and problems quickly
- Track key transactions
- Search and create customizable charts for the metric timeslice data most important to you, including any custom metrics you are sending to New Relic.
- Alert your team when errors or problems occur before they affect your users
- Track performance after a deploy
Drill down into performance details
View logs for your infrastructure data
Bring your logs and application’s data together to make troubleshooting easier and faster. No need to switch to another UI page.
- With logs in context, you can see log messages related to your errors and traces directly in your app’s UI.
- You can also see logs in context of your infrastructure data, such as Kubernetes clusters.
Analyze business data
Use the PHP agent to organize, query, and visualize your data to answer key questions about application performance and customer experience.
- Use default transaction attributes or add your own
- Query your data using NRQL
- Send your own event data
- Create and share customizable, interactive dashboards
- The agent handles automatic and API instrumentation of your PHP code.
- The daemon acts as a proxy between the agent and the New Relic platform.
You can connect up to 500 applications/agents to one daemon. The daemon imposes sampling when the harvest cycle limits are reached, so consider this when deciding how many applications/agents to connect to a single daemon.
Tip
The number of applications/agents per daemon may be lower when running in separate Docker containers, depending on the capacity of the connection between containers.
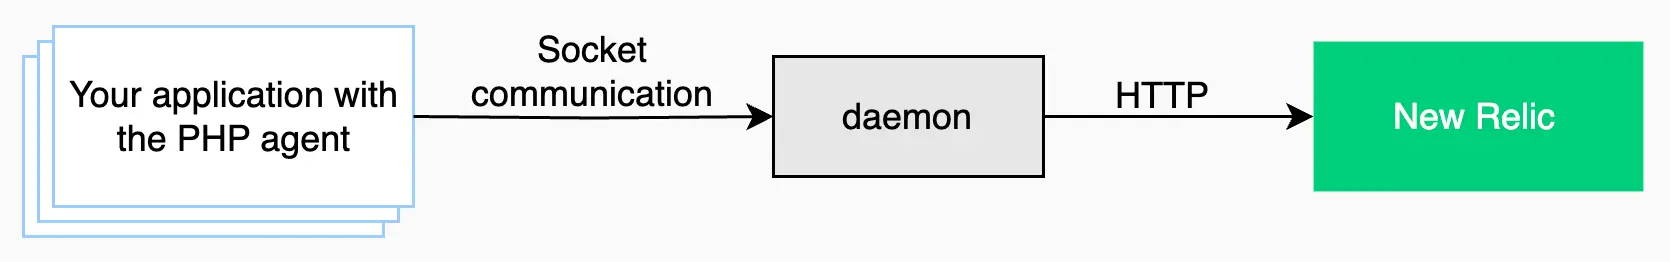
The flow of data from your PHP applications to New Relic.
The workflow between your application and New Relic must occur in this order:
- The agent establishes a socket connection with the daemon by sending the first payload of instrumentation data.
- The daemon establishes an HTTPS link with the New Relic platform. The daemon must be invoked before your instrumented application is invoked. This is called agent mode and is the default.
To avoid losing reported data, make sure your instrumented application doesn’t send transactions before both connections are established.
Before you install the PHP agent, ensure your system meets the system requirements. The PHP agent supports many of the most common PHP frameworks, databases, and libraries. You can also use the agent in a Google App Engine (GAE) flexible environment.
Tip
If you are installing the agent on a shared hosting service, ensure you have root permissions to install the agent or contact your hosting provider for technical assistance.
To install the agent, sign up for New Relic first. Once logged in, use our launcher, or see the instructions for specific installations.
- PHP agent installation overview (the basic installation steps for the most common setups).
- Installing on RedHat or CentOS
- Installing on Ubuntu or Debian
- Installing with tar archive (generic method to use on any supported systems such as Linux variants, OpenSolaris, SmartOS, FreeBSD, macOS, etc)
- The newrelic-install script (how to use the interactive script that automates some installation tasks)
For other types of PHP installations and advanced installation topics, see:
- PHP agent installation: Non-standard PHP
- Starting the PHP daemon (a standard New Relic installation starts the daemon automatically, but you can also start the daemon manually)
- Silent mode for the install script
- Google App Engine (GAE) flex environment installation for New Relic’s PHP agent
The agent includes a variety of configuration options to further customize and fine-tune your installation.
Tip
The most important part of agent configuration is to give your app a descriptive name. New Relic uses this app name to aggregate metrics when you have multiple apps or hosts.
Extend agent instrumentation
- Page load timing: Integrate the PHP agent with browser monitoring to gain visibility into end-user activity.
- Custom instrumentation: Instrument transactions not captured as part of our framework instrumentation.
- Agent API: Use the agent API to customize the agent’s behavior. For example, you can collect custom metrics, flag an error, or ignore a particular transaction entirely.
- Agent attributes: Customize the attributes attached to transactions. Customizing attributes allows you to avoid sending sensitive attributes, or to collect additional attributes for deeper visibility into your transactions.
Troubleshoot your installation