Как построить нормальное распределение в Python (с примерами)
Чтобы построить нормальное распределение в Python, вы можете использовать следующий синтаксис:
#x-axis ranges from -3 and 3 with .001 steps x = np.arange (-3, 3, 0.001) #plot normal distribution with mean 0 and standard deviation 1 plt.plot (x, norm. pdf (x, 0, 1)) Массив x определяет диапазон для оси x, а plt.plot() создает кривую для нормального распределения с указанным средним значением и стандартным отклонением.
В следующих примерах показано, как использовать эти функции на практике.
Пример 1: построение одного нормального распределения
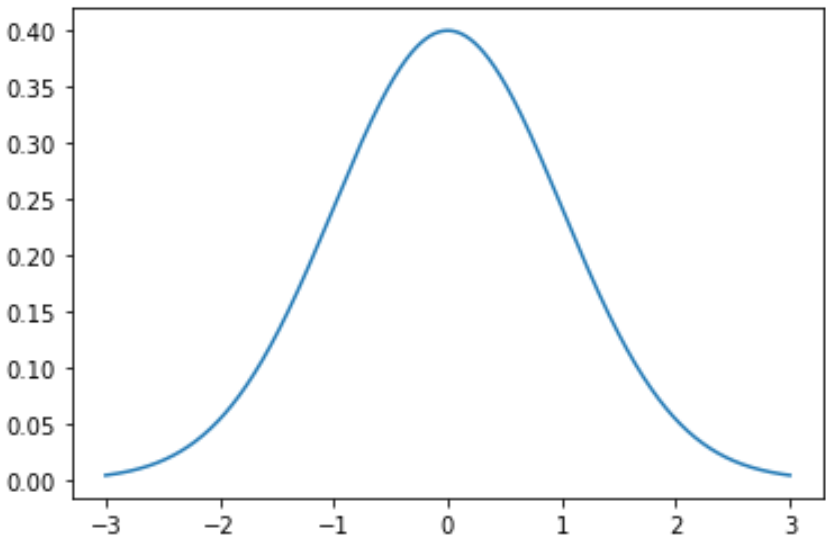
Следующий код показывает, как построить одну кривую нормального распределения со средним значением 0 и стандартным отклонением 1:
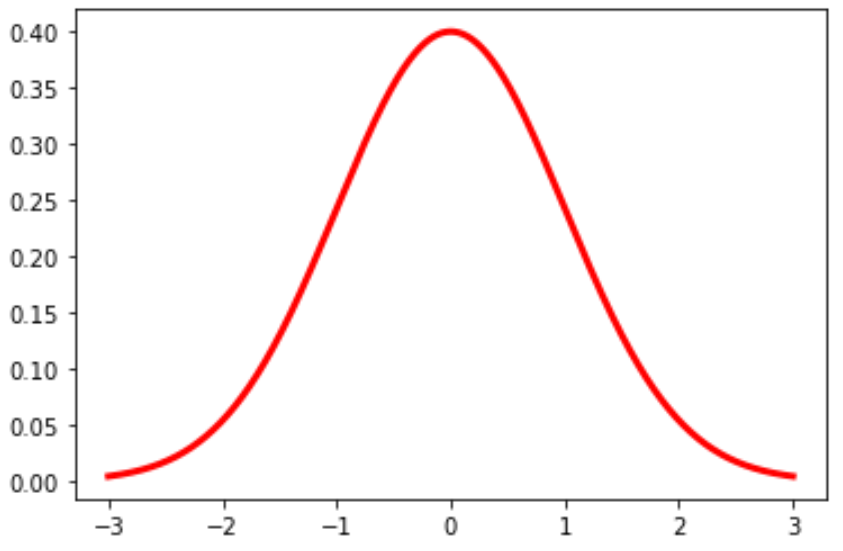
import numpy as np import matplotlib.pyplot as plt from scipy. stats import norm #x-axis ranges from -3 and 3 with .001 steps x = np.arange (-3, 3, 0.001) #plot normal distribution with mean 0 and standard deviation 1 plt.plot (x, norm. pdf (x, 0, 1)) Вы также можете изменить цвет и ширину линии на графике:
plt.plot (x, norm. pdf (x, 0, 1), color='red', linewidth= 3 ) Пример 2: построение нескольких нормальных распределений
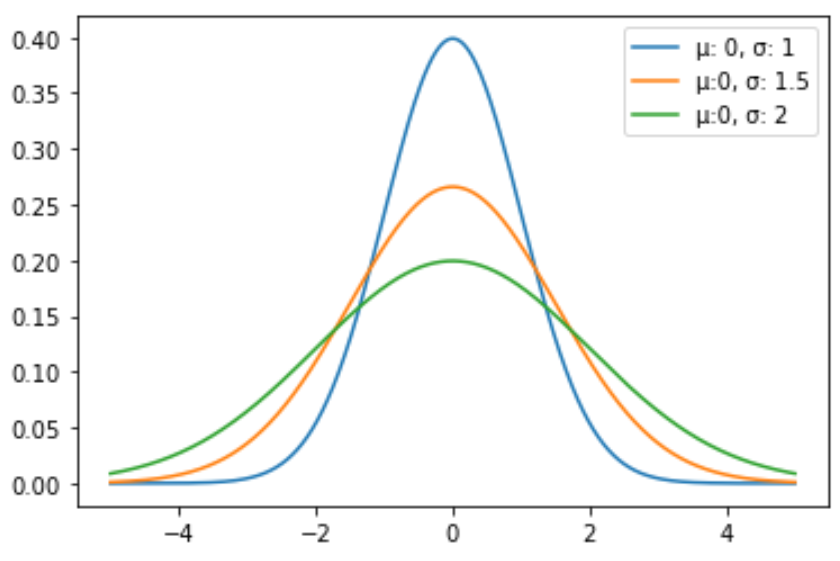
Следующий код показывает, как построить несколько кривых нормального распределения с разными средними значениями и стандартными отклонениями:
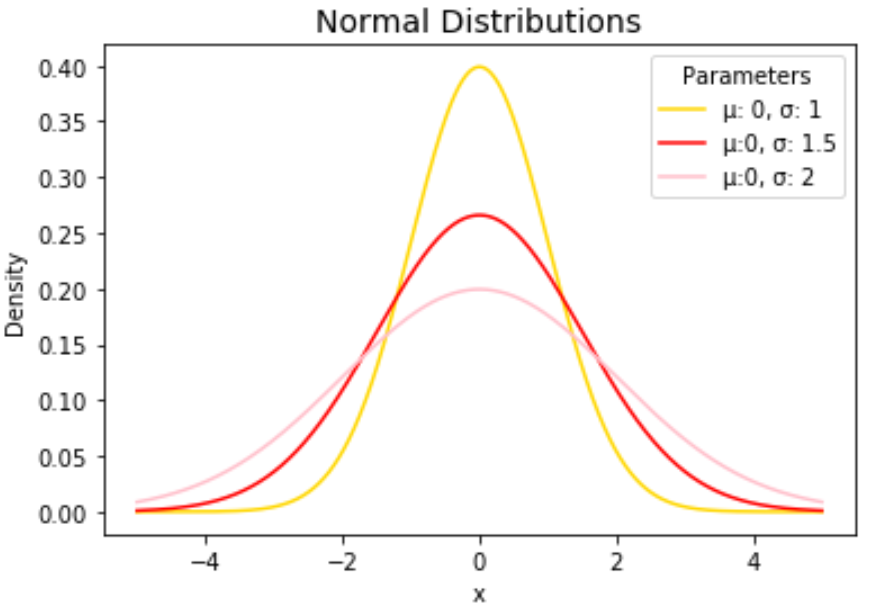
import numpy as np import matplotlib.pyplot as plt from scipy. stats import norm #x-axis ranges from -5 and 5 with .001 steps x = np.arange (-5, 5, 0.001) #define multiple normal distributions plt.plot (x, norm. pdf (x, 0, 1), label='μ: 0, σ: 1') plt.plot (x, norm. pdf (x, 0, 1.5), label='μ:0, σ: 1.5') plt.plot (x, norm. pdf (x, 0, 2), label='μ:0, σ: 2') #add legend to plot plt.legend() Не стесняйтесь изменять цвета линий и добавлять заголовок и метки осей, чтобы сделать диаграмму завершенной:
import numpy as np import matplotlib.pyplot as plt from scipy. stats import norm #x-axis ranges from -5 and 5 with .001 steps x = np.arange (-5, 5, 0.001) #define multiple normal distributions plt.plot (x, norm. pdf (x, 0, 1), label='μ: 0, σ: 1', color='gold') plt.plot (x, norm. pdf (x, 0, 1.5), label='μ:0, σ: 1.5', color='red') plt.plot (x, norm. pdf (x, 0, 2), label='μ:0, σ: 2', color='pink') #add legend to plot plt.legend(title='Parameters') #add axes labels and a title plt.ylabel('Density') plt.xlabel('x') plt.title('Normal Distributions', fontsize= 14 ) Подробное описание функции plt.plot() см. в документации по matplotlib.
numpy.random.normal#
Draw random samples from a normal (Gaussian) distribution.
The probability density function of the normal distribution, first derived by De Moivre and 200 years later by both Gauss and Laplace independently [2], is often called the bell curve because of its characteristic shape (see the example below).
The normal distributions occurs often in nature. For example, it describes the commonly occurring distribution of samples influenced by a large number of tiny, random disturbances, each with its own unique distribution [2].
New code should use the normal method of a Generator instance instead; please see the Quick Start .
Mean (“centre”) of the distribution.
scale float or array_like of floats
Standard deviation (spread or “width”) of the distribution. Must be non-negative.
size int or tuple of ints, optional
Output shape. If the given shape is, e.g., (m, n, k) , then m * n * k samples are drawn. If size is None (default), a single value is returned if loc and scale are both scalars. Otherwise, np.broadcast(loc, scale).size samples are drawn.
Returns : out ndarray or scalar
Drawn samples from the parameterized normal distribution.
probability density function, distribution or cumulative density function, etc.
which should be used for new code.
The probability density for the Gaussian distribution is
where \(\mu\) is the mean and \(\sigma\) the standard deviation. The square of the standard deviation, \(\sigma^2\) , is called the variance.
The function has its peak at the mean, and its “spread” increases with the standard deviation (the function reaches 0.607 times its maximum at \(x + \sigma\) and \(x — \sigma\) [2]). This implies that normal is more likely to return samples lying close to the mean, rather than those far away.
P. R. Peebles Jr., “Central Limit Theorem” in “Probability, Random Variables and Random Signal Principles”, 4th ed., 2001, pp. 51, 51, 125.
Draw samples from the distribution:
>>> mu, sigma = 0, 0.1 # mean and standard deviation >>> s = np.random.normal(mu, sigma, 1000)
Verify the mean and the variance:
>>> abs(mu - np.mean(s)) 0.0 # may vary
>>> abs(sigma - np.std(s, ddof=1)) 0.1 # may vary
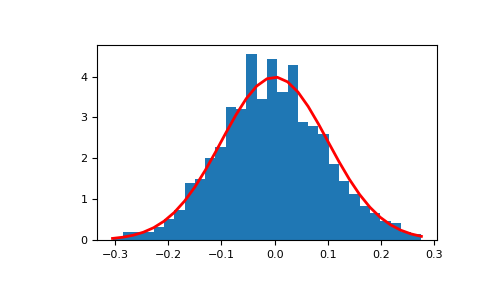
Display the histogram of the samples, along with the probability density function:
>>> import matplotlib.pyplot as plt >>> count, bins, ignored = plt.hist(s, 30, density=True) >>> plt.plot(bins, 1/(sigma * np.sqrt(2 * np.pi)) * . np.exp( - (bins - mu)**2 / (2 * sigma**2) ), . linewidth=2, color='r') >>> plt.show()
Two-by-four array of samples from the normal distribution with mean 3 and standard deviation 2.5:
>>> np.random.normal(3, 2.5, size=(2, 4)) array([[-4.49401501, 4.00950034, -1.81814867, 7.29718677], # random [ 0.39924804, 4.68456316, 4.99394529, 4.84057254]]) # random
scipy.stats.norm#
The location ( loc ) keyword specifies the mean. The scale ( scale ) keyword specifies the standard deviation.
As an instance of the rv_continuous class, norm object inherits from it a collection of generic methods (see below for the full list), and completes them with details specific for this particular distribution.
The probability density function for norm is:
The probability density above is defined in the “standardized” form. To shift and/or scale the distribution use the loc and scale parameters. Specifically, norm.pdf(x, loc, scale) is identically equivalent to norm.pdf(y) / scale with y = (x — loc) / scale . Note that shifting the location of a distribution does not make it a “noncentral” distribution; noncentral generalizations of some distributions are available in separate classes.
>>> import numpy as np >>> from scipy.stats import norm >>> import matplotlib.pyplot as plt >>> fig, ax = plt.subplots(1, 1)
Calculate the first four moments:
>>> mean, var, skew, kurt = norm.stats(moments='mvsk')
Display the probability density function ( pdf ):
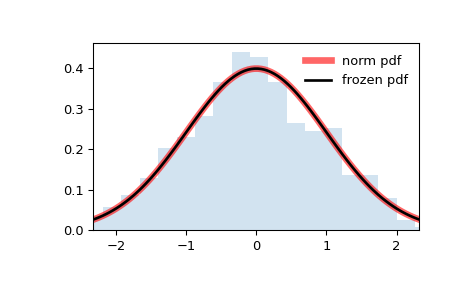
>>> x = np.linspace(norm.ppf(0.01), . norm.ppf(0.99), 100) >>> ax.plot(x, norm.pdf(x), . 'r-', lw=5, alpha=0.6, label='norm pdf')
Alternatively, the distribution object can be called (as a function) to fix the shape, location and scale parameters. This returns a “frozen” RV object holding the given parameters fixed.
Freeze the distribution and display the frozen pdf :
>>> rv = norm() >>> ax.plot(x, rv.pdf(x), 'k-', lw=2, label='frozen pdf')
Check accuracy of cdf and ppf :
>>> vals = norm.ppf([0.001, 0.5, 0.999]) >>> np.allclose([0.001, 0.5, 0.999], norm.cdf(vals)) True
And compare the histogram:
>>> ax.hist(r, density=True, bins='auto', histtype='stepfilled', alpha=0.2) >>> ax.set_xlim([x[0], x[-1]]) >>> ax.legend(loc='best', frameon=False) >>> plt.show()
rvs(loc=0, scale=1, size=1, random_state=None)
pdf(x, loc=0, scale=1)
Probability density function.
logpdf(x, loc=0, scale=1)
Log of the probability density function.
cdf(x, loc=0, scale=1)
Cumulative distribution function.
logcdf(x, loc=0, scale=1)
Log of the cumulative distribution function.
sf(x, loc=0, scale=1)
Survival function (also defined as 1 — cdf , but sf is sometimes more accurate).
logsf(x, loc=0, scale=1)
Log of the survival function.
ppf(q, loc=0, scale=1)
Percent point function (inverse of cdf — percentiles).
isf(q, loc=0, scale=1)
Inverse survival function (inverse of sf ).
moment(order, loc=0, scale=1)
Non-central moment of the specified order.
stats(loc=0, scale=1, moments=’mv’)
Mean(‘m’), variance(‘v’), skew(‘s’), and/or kurtosis(‘k’).
entropy(loc=0, scale=1)
(Differential) entropy of the RV.
Parameter estimates for generic data. See scipy.stats.rv_continuous.fit for detailed documentation of the keyword arguments.
expect(func, args=(), loc=0, scale=1, lb=None, ub=None, conditional=False, **kwds)
Expected value of a function (of one argument) with respect to the distribution.
median(loc=0, scale=1)
Median of the distribution.
mean(loc=0, scale=1)
var(loc=0, scale=1)
Variance of the distribution.
std(loc=0, scale=1)
Standard deviation of the distribution.
interval(confidence, loc=0, scale=1)
Confidence interval with equal areas around the median.
