How do I set the figure title and axes labels font size?
I want to specify font sizes for the figure title and the axis labels. I need all three to be different font sizes, so setting a global font size ( mpl.rcParams[‘font.size’]=x ) is not what I want. How do I set font sizes for the figure title and the axis labels individually?
12 Answers 12
Functions dealing with text like label , title , etc. accept parameters same as matplotlib.text.Text . For the font size you can use size/fontsize :
from matplotlib import pyplot as plt fig = plt.figure() plt.plot(data) fig.suptitle('test title', fontsize=20) plt.xlabel('xlabel', fontsize=18) plt.ylabel('ylabel', fontsize=16) fig.savefig('test.jpg') For globally setting title and label sizes, mpl.rcParams contains axes.titlesize and axes.labelsize . (From the page):
axes.titlesize : large # fontsize of the axes title axes.labelsize : medium # fontsize of the x any y labels (As far as I can see, there is no way to set x and y label sizes separately.)
And I see that axes.titlesize does not affect suptitle . I guess, you need to set that manually.
thanks! is there a way to set that globally but explicitly for (suptitle, xlabel, ylabel)? I am making a lot of charts and just want to specify it once.
@vasek1: I thought you didn’t want global setting :). For that you need mpl.rcParams . I’ve edited my answer.
@AlexanderMcFarlane. I ran python -c ‘import matplotlib as mpl; print(mpl.__version__); print(«figure.titlesize» in mpl.rcParams.keys())’ . Result is 1.5.1 , True . 1) What version of matplotlib are you using? What version of Python? 2) Could it be a bug where for some reason it accepts str but not unicode in Py2?
You can also do this globally via a rcParams dictionary:
import matplotlib.pylab as pylab params = pylab.rcParams.update(params) Thanks. Is there a way to globally set explicit numeric sizes for the title and the axis-labels instead of always doing ax.set_title(‘some title’, fontsize=15) , ax.set_xlabel(‘some xlabel’, fontsize=12) ? It seems like rcParams only accepts strings.
If you’re more used to using ax objects to do your plotting, you might find the ax.xaxis.label.set_size() easier to remember, or at least easier to find using tab in an ipython terminal. It seems to need a redraw operation after to see the effect. For example:
import matplotlib.pyplot as plt # set up a plot with dummy data fig, ax = plt.subplots() x = [0, 1, 2] y = [0, 3, 9] ax.plot(x,y) # title and labels, setting initial sizes fig.suptitle('test title', fontsize=12) ax.set_xlabel('xlabel', fontsize=10) ax.set_ylabel('ylabel', fontsize='medium') # relative to plt.rcParams['font.size'] # setting label sizes after creation ax.xaxis.label.set_size(20) plt.draw() I don’t know of a similar way to set the suptitle size after it’s created.
fig.suptitle(‘test title’, fontsize = 20) seems to work. ax.set_xlabel(‘xlabel’, fontsize = 20)’ also works, in which case we can do away with ax.xaxis.label.set_size(20)`.
@T_T That’s true, and these forms are similar to Avaris’ answer above. I’ll add them for completeness. I still find a use for ax.xaxis.label.set_size() when I’m working interactively with an ipython plot and I want to do a quick visual assessment of a variety of font sizes.
Do you know if there’s any (hidden) difference between using ax objects and figure objects, or are both perfectly equivalent? Why are there different interfaces for some of the features? (plt.xlabel() vs. ax.set_xlabel())
@normanius, if you mean ax and fig in the above example, they are quite different objects — fig is the overall figure, which may contain several axes. So fig and ax have different properties. In terms of the difference between the pyplot type calls and object calls (e.g. plt.xlabel() vs. ax.set_xlabel() as you say), they are equivalent, with the caveat that the plt.* functions work on the current axis/figure. So it you set up a figure with multiple axes, you’ll probably want to use explicit calls like ax1.set_xlabel() to avoid confusion.
To only modify the title’s font (and not the font of the axis) I used this:
import matplotlib.pyplot as plt fig = plt.Figure() ax = fig.add_subplot(111) ax.set_title('My Title', fontdict=) The fontdict accepts all kwargs from matplotlib.text.Text.
I’m running Python 3.8.5 and I don’t need to use fontdict . It does work, but you can also use: ax.set_title(«My Title», fontsize=18, fontwieght=»medium») . This also works on ax2.set_xticklabels etc.
Per the official guide, use of pylab is no longer recommended. matplotlib.pyplot should be used directly instead.
Globally setting font sizes via rcParams should be done with
import matplotlib.pyplot as plt plt.rcParams['axes.labelsize'] = 16 plt.rcParams['axes.titlesize'] = 16 # or params = plt.rcParams.update(params) # or import matplotlib as mpl mpl.rc('axes', labelsize=16, titlesize=16) # or axes = mpl.rc('axes', **axes) The defaults can be restored using
plt.rcParams.update(plt.rcParamsDefault) You can also do this by creating a style sheet in the stylelib directory under the matplotlib configuration directory (you can get your configuration directory from matplotlib.get_configdir() ). The style sheet format is
axes.labelsize: 16 axes.titlesize: 16 If you have a style sheet at /path/to/mpl_configdir/stylelib/mystyle.mplstyle then you can use it via
plt.style.use('mystyle') # or, for a single section with plt.style.context('mystyle'): # . You can also create (or modify) a matplotlibrc file which shares the format
axes.labelsize = 16 axes.titlesize = 16 Depending on which matplotlibrc file you modify these changes will be used for only the current working directory, for all working directories which do not have a matplotlibrc file, or for all working directories which do not have a matplotlibrc file and where no other matplotlibrc file has been specified. See this section of the customizing matplotlib page for more details.
A complete list of the rcParams keys can be retrieved via plt.rcParams.keys() , but for adjusting font sizes you have (italics quoted from here)
- axes.labelsize — Fontsize of the x and y labels
- axes.titlesize — Fontsize of the axes title
- figure.titlesize — Size of the figure title ( Figure.suptitle() )
- xtick.labelsize — Fontsize of the tick labels
- ytick.labelsize — Fontsize of the tick labels
- legend.fontsize — Fontsize for legends ( plt.legend() , fig.legend() )
- legend.title_fontsize — Fontsize for legend titles, None sets to the same as the default axes. See this answer for usage example.
all of which accept string sizes or a float in pt . The string sizes are defined relative to the default font size which is specified by
Additionally, the weight can be specified (though only for the default it appears) by
- font.weight — The default weight of the font used by text.Text . Accepts or ‘normal’ (400), ‘bold’ (700), ‘lighter’ , and ‘bolder’ (relative with respect to current weight).
Titles in matplotlib
Adding titles in matplotlib with title and set_title
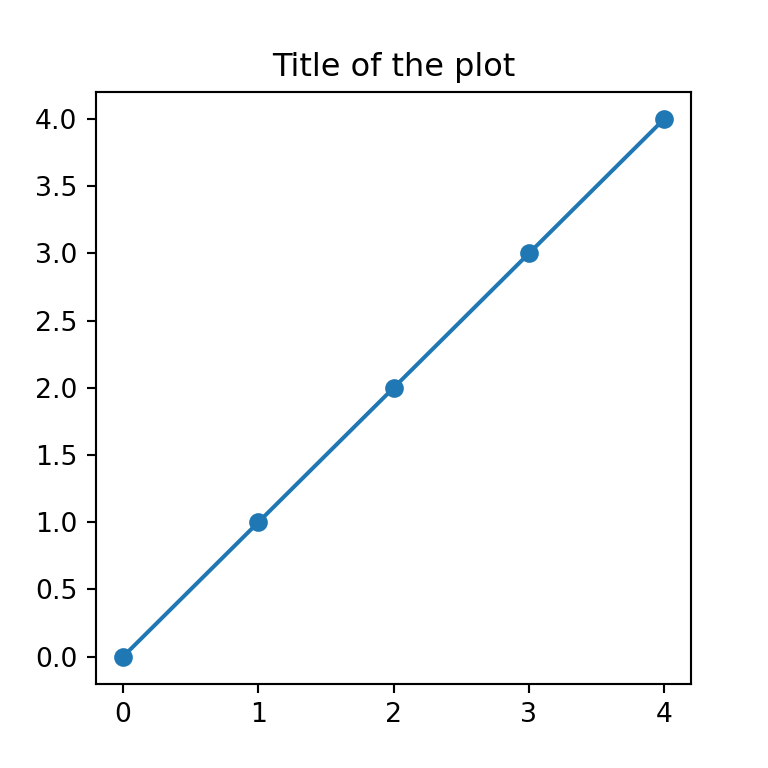
Matplotlib allows adding titles to the charts by using the title or the set_title functions. The difference between these two functions is that the first is for adding a title for a single plot while the latter is for adding titles for subplots. The selection between each function will depend on the number of plots and the approach you want to use.
import matplotlib.pyplot as plt fig, ax = plt.subplots() ax.plot(range(5), marker = "o") plt.title('Title of the plot') # plt.show() # Other approach: fig, ax = plt.subplots() ax.plot(range(5), marker = "o") ax.set_title('Title of the plot') # plt.show()Title with multiple lines
Note that by using \n you will be able to break the lines and hence to set a title with multiple lines in Python.
import matplotlib.pyplot as plt fig, ax = plt.subplots() ax.plot(range(5), marker = "o") plt.title('Title of the plot\nwith two lines') # plt.show()Title position
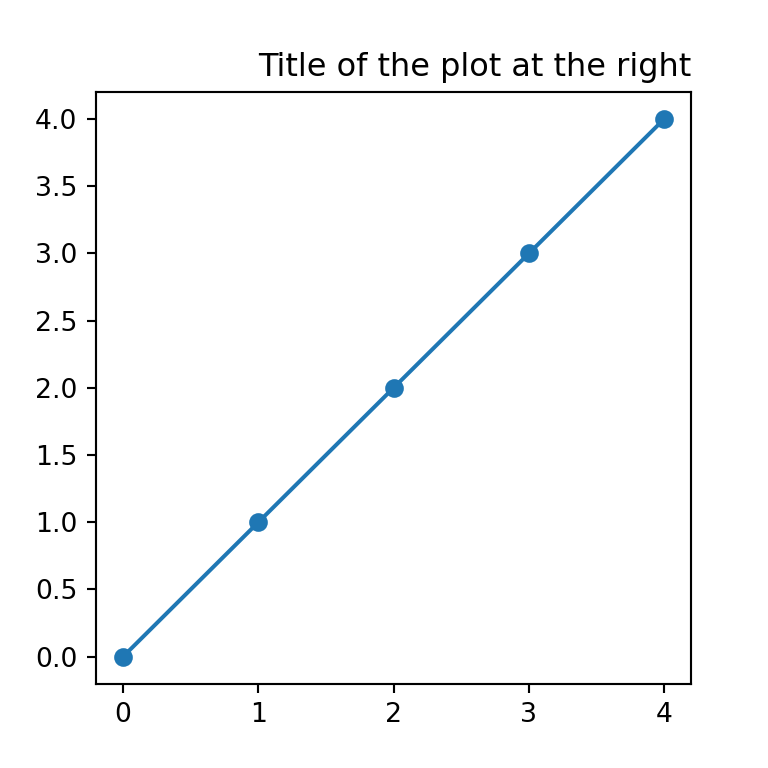
The title function provides the loc argument which defaults to «center» , but you can also set the title position to the left or to the right with «left» or «right» .
import matplotlib.pyplot as plt fig, ax = plt.subplots() ax.plot(range(5), marker = "o") plt.title('Title of the plot at the right', loc = "right") # plt.show()You can also use the pad argument to specify the offset of the title, in points, from the top of the axes.
Several titles
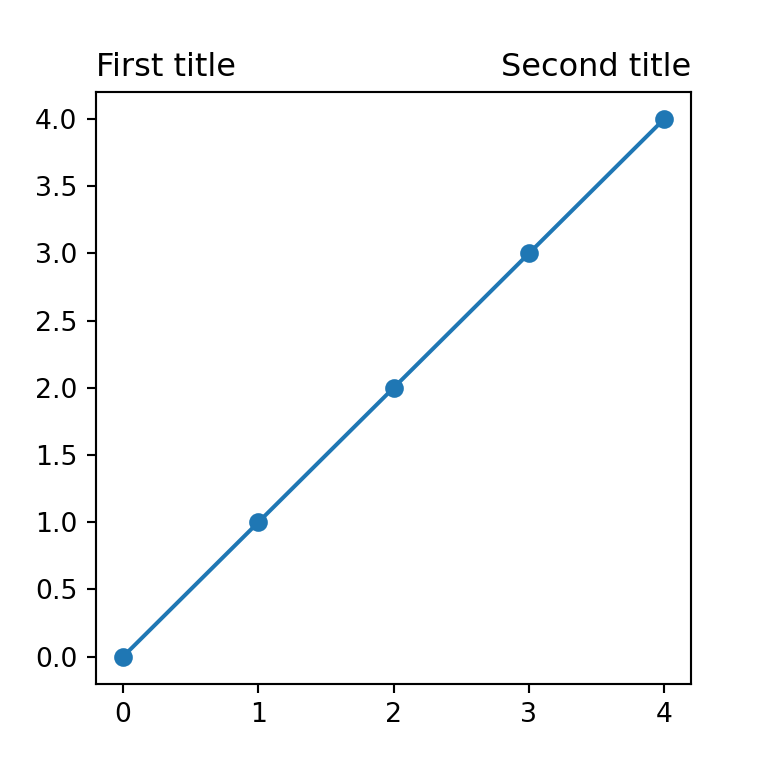
Using the title function several times you can add several titles, as long as they are in different position, otherwise the titles will be overwritten.
import matplotlib.pyplot as plt fig, ax = plt.subplots() ax.plot(range(5), marker = "o") plt.title('First title', loc = "left") plt.title('Second title', loc = "right") # plt.show()Title font size
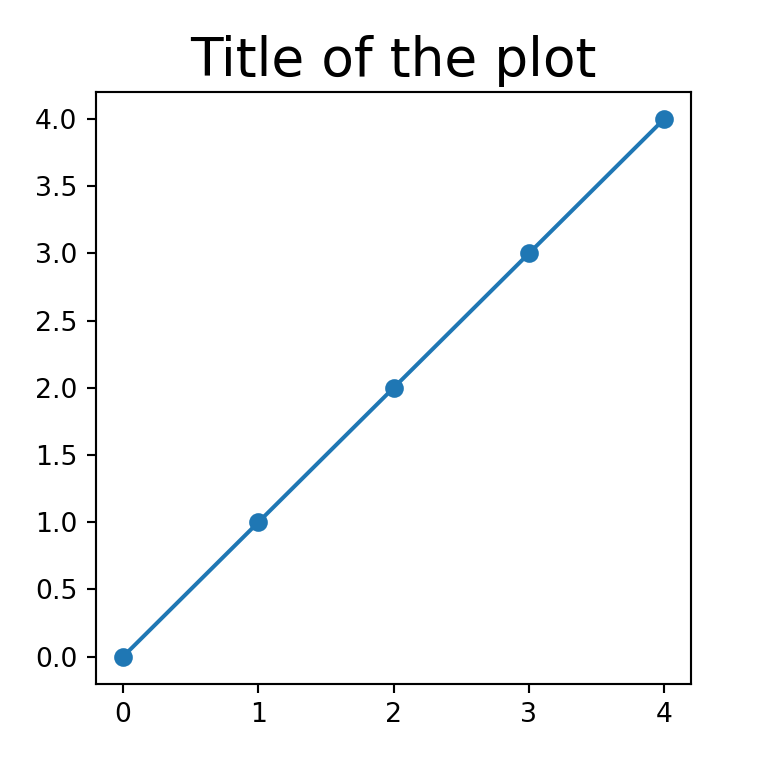
The size of the font of the main title can be customized through the fontsize argument.
import matplotlib.pyplot as plt fig, ax = plt.subplots() ax.plot(range(5), marker = "o") plt.title('Title of the plot', fontsize = 20) # plt.show()Title color
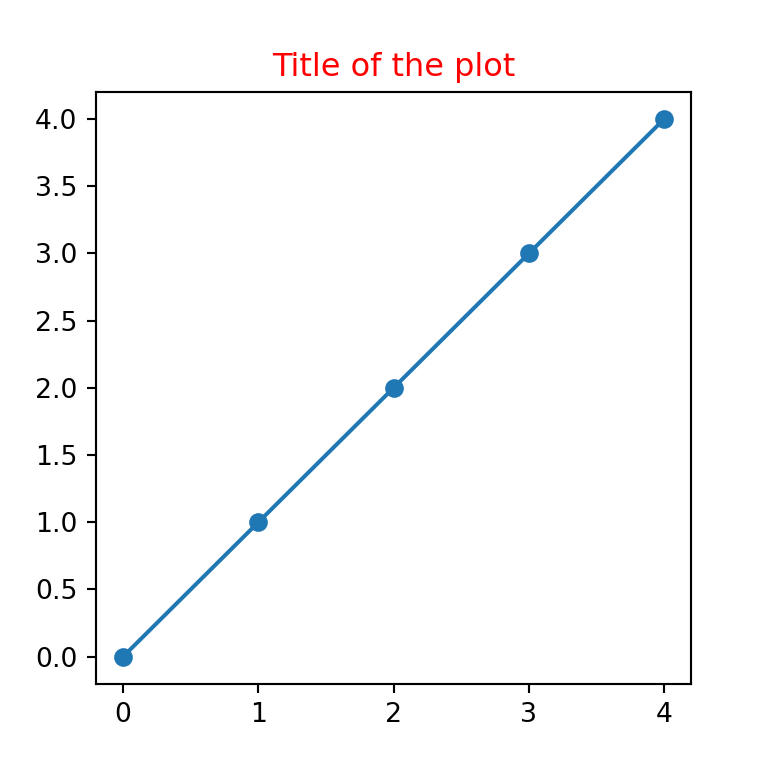
In addition, the color of the text can be changed by using the color argument, as shown below.
import matplotlib.pyplot as plt fig, ax = plt.subplots() ax.plot(range(5), marker = "o") plt.title('Title of the plot', color = "red") # plt.show()Title font style
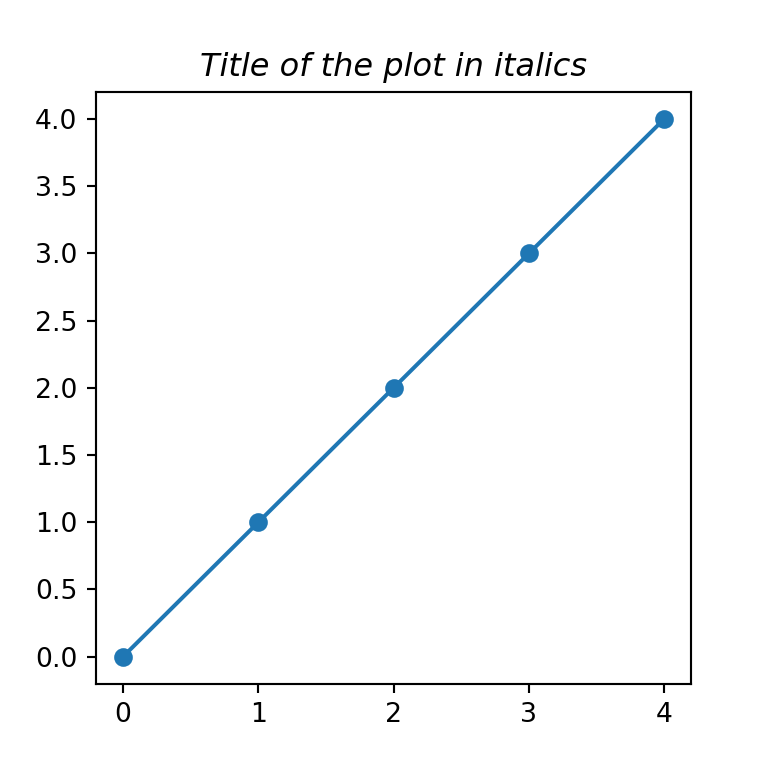
You can also use a different font style, as bold or italic, by using the style argument.
import matplotlib.pyplot as plt fig, ax = plt.subplots() ax.plot(range(5), marker = "o") plt.title('Title of the plot in italics', style = "italic") # plt.show()It is possible to customize the styling of the titles with a single dict named fontdict , where each key will be the arguments described before.
Mathematical expressions
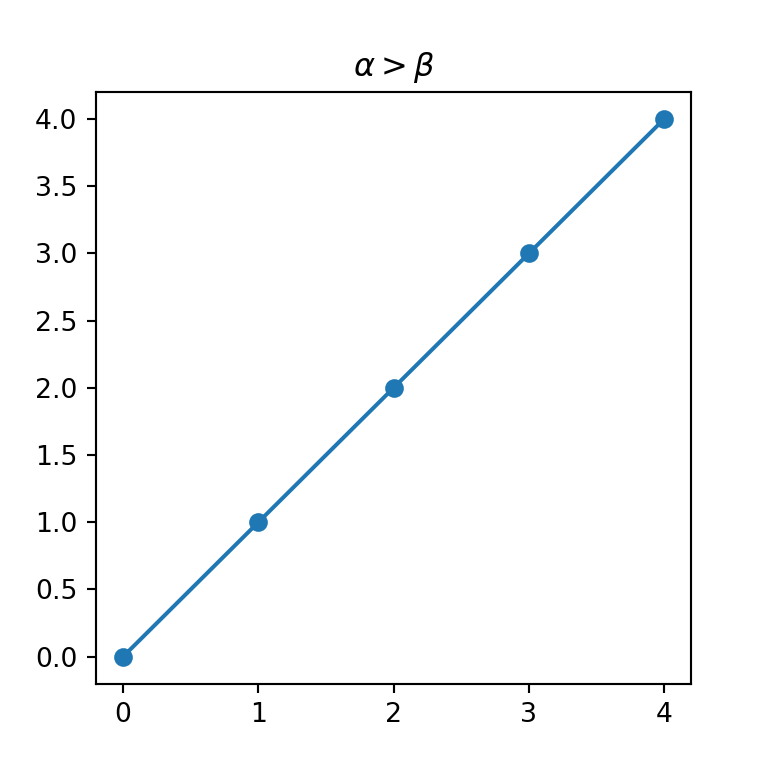
It is worth to mention that you can use mathematical expressions in your titles. For this purpose, you will need to write your TeX code inside r’$ $’ , as in the following example:
import matplotlib.pyplot as plt fig, ax = plt.subplots() ax.plot(range(5), marker = "o") plt.title(r'$\alpha > \beta$') # plt.show()Figure title and subtitle with suptitle
Matplotlib also provides a function named suptitle , which can be used for adding subtitles or for adding figure titles.
The easiest way to add a subtitle in Python is using suptitle to set the main title and then setting the subtitle with title , as shown below.
import matplotlib.pyplot as plt fig, ax = plt.subplots() ax.plot(range(5), marker = "o") fig.suptitle('Main title') plt.title('Subtitle') # plt.show()Figure title
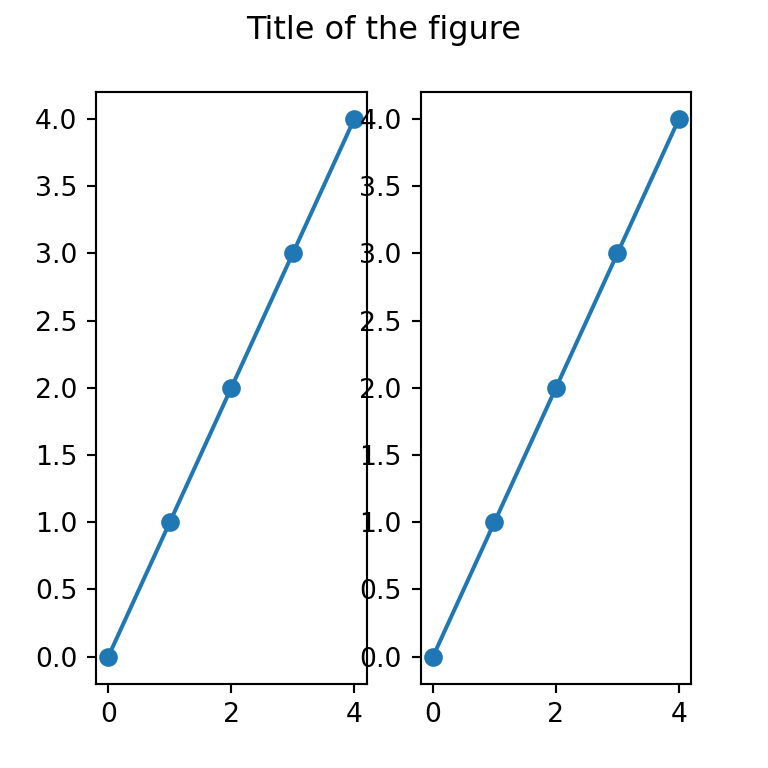
However, the suptitle function is designed to set a figure-level title, so in case you want to add an overall title for several plots you can use it.
import matplotlib.pyplot as plt fig, (ax1, ax2) = plt.subplots(1, 2) # Plots ax1.plot(range(5), marker = "o") ax2.plot(range(5), marker = "o") fig.suptitle('Title of the figure') # plt.show()Subplot titles
Note that you can also add individual titles for each subplot by using the set_title function.
import matplotlib.pyplot as plt fig, (ax1, ax2) = plt.subplots(1, 2) # Plots ax1.plot(range(5), marker = "o") ax2.plot(range(5), marker = "o") fig.suptitle('Title of the figure') # Titles for each plot ax1.set_title('First title') ax2.set_title('Second title') # plt.show()