- Мониторинг микросервисов Flask с помощью Prometheus
- Пара строк кода и ваше приложение генерирует метрики, вау!
- Настройка
- Сбор метрик
- Ссылки
- Monitoring Python Using Prometheus
- Python Flask
- Rate Errors and Duration
- Add Your Own
- Using Metrics
- Sign up for our newsletter.
- Avoiding The 20 Dashboard Tabs Problem
- Automatic Discovery of Application Topology
- Observability — Build vs Buy
Мониторинг микросервисов Flask с помощью Prometheus
Пара строк кода и ваше приложение генерирует метрики, вау!
Для того что бы понять как работает prometheus_flask_exporter достаточно минимального примера:
from flask import Flask from prometheus_flask_exporter import PrometheusMetrics app = Flask(__name__) metrics = PrometheusMetrics(app) @app.route('/') def main(): return 'OK'Это все что нужно для начала! Добавив импорт и строку для инициализации PrometheusMetrics, вы получите метрики продолжительности запросов и счетчики запросов, отображаемые в конечной точке /metrics приложения Flask, в котором оно зарегистрировано, а также все метрики по умолчанию, которые вы получаете из базовой клиентской библиотеки Prometheus.
Вы можете найти простой в использовании пример в репозитории GitHub, который запускает экземпляр Prometheus и Grafana вместе с демонстрационным приложением для генерации метрик, которые будут выглядеть примерно так:
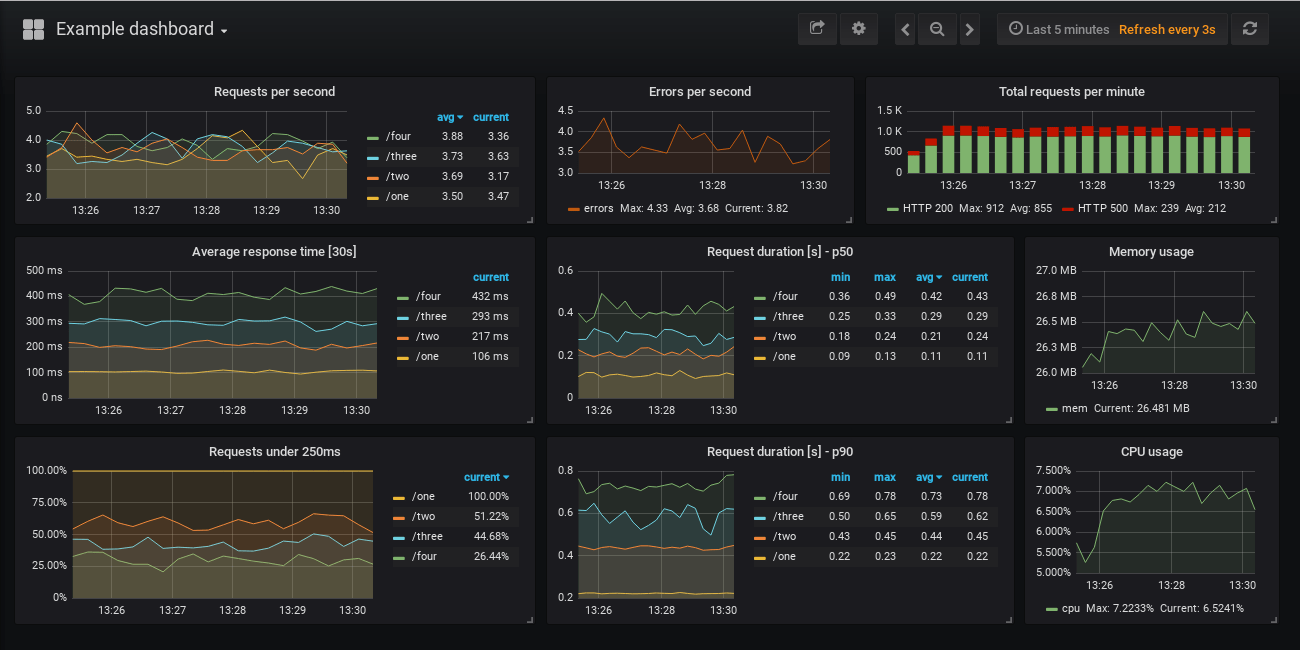
Вы также найдете список показателей в README примера, которые отображаются на панели управления, вместе с запросами Prometheus, которые заполняют панели.
Настройка
В библиотеке есть множество опций конфигурации, посмотрите в README проекта их примеры с кратким объяснением.
Базовая конфигурация показана вверху. Просто создайте экземпляр PrometheusMetrics, назовем его metrics, а затем с его помощью определите дополнительные метрики, которые вы хотите собирать, декорировав функции:
Счетчики подсчитывают вызовы, а остальные собирают метрики в зависимости от продолжительности этих вызовов. Вы можете определить метки для каждого из них, потенциально используя свойства запроса или ответа. Например:
from flask import Flask, request from prometheus_flask_exporter import PrometheusMetrics app = Flask(__name__) # group by endpoint rather than path metrics = PrometheusMetrics(app, group_by='endpoint') @app.route('/collection/:collection_id/item/:item_id') @metrics.counter( 'cnt_collection', 'Number of invocations per collection', labels=< 'collection': lambda: request.view_args['collection_id'], 'status': lambda resp: resp.status_code >) def get_item_from_collection(collection_id, item_id): passВ приведенном выше примере нажатие на конечную точку /collection/10002/item/76 приведет к увеличению счетчика, например cnt_collection , плюс вы получите метрики по умолчанию (для каждой конечной точки в этом примере ) из библиотеки по умолчанию:
- flask_http_request_duration_seconds — Продолжительность HTTP-запроса в секундах для всех запросов Flask по методу, пути и статусу
- flask_http_request_total — Общее количество HTTP-запросов по методам и статусам
Есть варианты пропустить отслеживание определенных конечных точек, зарегистрировать дополнительные метрики по умолчанию или пропустить те, что указаны выше, или применить одну и ту же настраиваемую метрику к нескольким конечным точкам. Ознакомьтесь с README проекта, чтобы узнать, что доступно.
app = Flask(__name__) metrics = PrometheusMetrics(app) @app.route('/') def main(): pass # requests tracked by default @app.route('/skip') @metrics.do_not_track() def skip(): pass # default metrics are not collected # custom metric to be applied to multiple endpoints common_counter = metrics.counter( 'by_endpoint_counter', 'Request count by endpoints', labels= ) @app.route('/common/one') @common_counter def endpoint_one(): pass # tracked by the custom and the default metrics @app.route('/common/two') @common_counter def endpoint_two(): pass # also tracked by the custom and the default metrics # register additional default metrics metrics.register_default( metrics.counter( 'by_path_counter', 'Request count by request paths', labels= ) )В библиотеке есть удобные расширения для популярных многопроцессорных библиотек, таких как uWSGI и Gunicorn. Вы также можете найти небольшие примеры целевых вариантов использования, в том числе многопроцессорных.
Сбор метрик
Как упоминалось выше, библиотека по умолчанию предоставляет конечную точку /metrics в приложении Flask, которая может служить целью для сборщика Prometheus.
В приведенном выше примере с дашбордом вы можете нацелить свой Prometheus на приложение Flask с настройками по умолчанию с такой конфигурацией:
scrape_configs: - job_name: 'example' dns_sd_configs: - names: ['app'] port: 5000 type: A refresh_interval: 5sСмотрите полный пример в репозитории GitHub. Это предполагает, что Prometheus может найти ваши экземпляры приложения Flask на http://app:5000/metrics, где имя домена приложения может потенциально разрешаться на несколько IP-адресов, например, при работе в Kubernetes или Docker Swarm.
Если такое раскрытие конечной точки метрик вам не подходит, возможно, потому что вы не хотите разрешать внешний доступ к ней, вы можете легко отключить ее, передав path=None при создании экземпляра PrometheusMetrics.
from flask import Flask, request from prometheus_flask_exporter import PrometheusMetrics app = Flask(__name__) metrics = PrometheusMetrics(app, path=None) . metrics.start_http_server(5099)Затем вы можете использовать start_http_server(port), чтобы открыть эту конечную точку на другом HTTP-порту, 5099 в приведенном выше примере. В качестве альтернативы, если вас устраивает то, что конечная точка находится в том же приложении Flask, но вам нужно изменить ее путь от /metrics, вы можете либо передать другой URI в качестве параметра пути, либо использовать register_endpoint(..), чтобы установить это позже.
Ссылки
- rycus86/prometheus_flask_exporter — Этот экспортер флаконов для Prometheus
- prometheus-flask-exporter README — Использование, примеры и параметры конфигурации
- prometheus-flask-exporter examples — Примеры настройки мониторинга приложений Flask разными способами
- prometheus-flask-exporter on PyPI — Этот проект на PyPI
- prometheus/client_python — Официальная клиентская библиотека Prometheus для Python
Если вы решите попробовать, не стесняйтесь откройте issue на GitHub или оставлять свои комментарии, отзывы и предложения!
Monitoring Python Using Prometheus

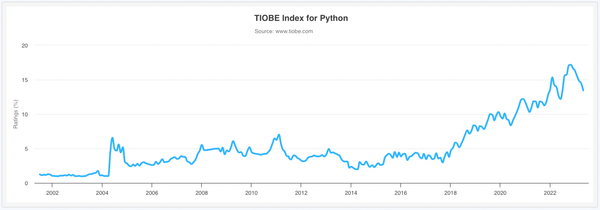
According to the Tiobe programming language popularity index, Python is number one and continuing to gain in popularity.
For observability Prometheus has become the de facto standard for open source, with 1B+ pulls from Docker Hub and nearly 50k stars on GitHub. Many other open source projects include a Prometheus metrics endpoint and for those that do not, there’s a comprehensive collection of exporters and a rich set of client libraries for most languages.
Taking a simple Python Flask application, this article will look at what’s required to monitor Python applications using Prometheus.
Python Flask
Flask is a popular, 63k GitHub stars, application framework for Python. It’s built on WSGI which provides the HTTP server and is an ideal approach for micro services applications. Flask handles the routing of HTTP requests to the matching Python function.
app = Flask('my-app') @app.route('/health', methods=['GET']) def health(): return 'OK\n'The snippet above shows the Flask application being initialised with the name «my-app» then a health check endpoint being added. Flask will call the health function for any HTTP GET request to the /health endpoint. The text «OK» along with a default HTTP Status Code of 200 will be the response returned to the client.
Request parameters can be handled in the URI path for REST services.
@app.route('/delete/', methods=['DEL']) def delete(id): error = None try: delete(id) except Exception as err: error = err if error: return str(err), 500 else: return 'OK\n'In this snippet the placeholder for the id parameter is declared in the path of the route. Flask will pass it in as the matching argument to the function. If an error occurs during the function call, the error message string and a status code of 500 is returned.
Rate Errors and Duration
Having written and deployed a Python Flask application, it would be useful to know how well it’s performing. Keeping an eye on the number of requests handled, the duration of those requests and a count of any errors.
Prometheus is the ideal way to capture and store these metrics along with additional Python runtime metrics. To collect metrics for each endpoint and the Python runtime requires just a few simple modifications.
from prometheus_flask_exporter import PrometheusMetrics def path(req): return '/' + req.path[1:].split('/')[0] app = Flask('my-app') metrics = PrometheusMetrics(app, group_by=path)Prometheus Flask Exporter is one of many community open source integrations and is easily installed with pip. The path function is used to prevent a cardinality explosion by returning just the first element of the request path for grouping. That’s all there is to it, the standard Prometheus /metrics endpoint will be exposed along with any endpoints of the application. The following metrics for each endpoint will be available:
- Request duration seconds — histogram
- Request total — counter
- Request exceptions total — counter
Add Your Own
Unlike commercial products, there’s no limit to the number of additional metrics you can add.
metrics.info('version_info', 'application version', version='1.0.1')Following on from the previous example the Prometheus Flask Exporter library provides a convenience call to create additional gauges to hold for example version or build information.
Because the exporter is built on top of the standard client library, the regular metrics types can be used.
from prometheus_client import Histogram cart_value = Histogram('my_app_cart_value', 'value of cart at checkout', buckets=[5, 10, 20, 50, 80, 100, 150, 200]) cart_value.observe(24.99)Any regular metrics created will automatically be added for collection to the /metrics endpoint.
Using Metrics
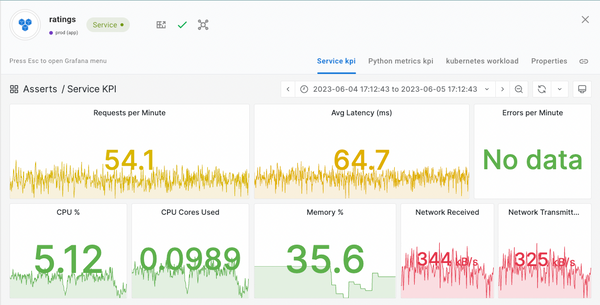
This article has shown just how easy it is to start collecting performance and business metrics from Python Flask applications. The next steps are to visualise the metric data on various dashboards and because nobody want to stare at dashboards all day, get alerted when things go wrong. At this point you could install Grafana to create a bunch of dashboards and configure Prometheus alerting rules. This is a lot of work and you’re going to have to learn PromQL.
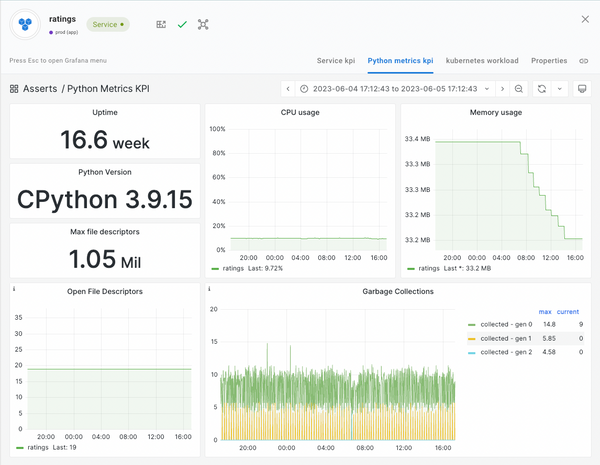
Alternatively, you could just install Asserts for free, forever and use the curated library of dashboards and alert rules, not just for Python but many other technologies too. Asserts Data Distiller takes the short term detailed data from Prometheus and keeps just what’s important long term for reporting and analysis. As you deploy more applications, Asserts Entity Graph provides a full stack topology view and automatic correlation and collation when an incident occurs.
Sign up for our newsletter.
Get the latest articles delivered straight to your inbox.

Avoiding The 20 Dashboard Tabs Problem
«My mind is like my browser. It has too many tabs open, some of them are frozen and I don’t know where the music is coming from» — Exhausted SRE trying to resolve an incident.
Automatic Discovery of Application Topology
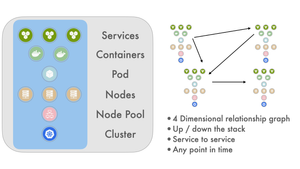
Asserts automatically analyses metric and trace metadata to build a graph database of application component relationships over time. This information is used to collate all affected application components onto a single dynamic dashboard when an incident occurs.

Observability — Build vs Buy
The requirement to observe and monitor modern distributed applications is no longer in question. The question is how to acquire that capability, build it or buy it?
Spot issues 10x faster with correlation intelligence.