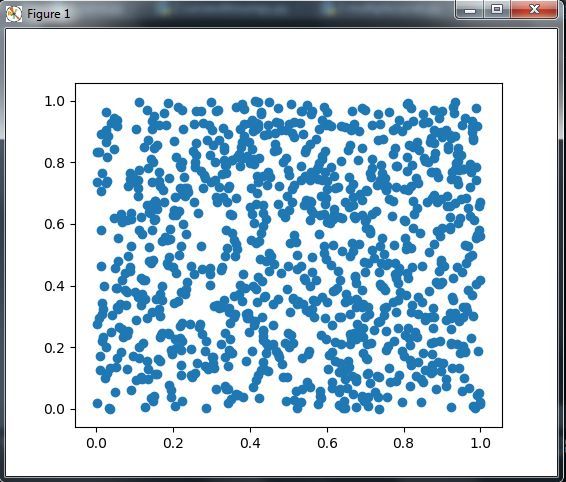
How to plot points in matplotlib with Python
In this article, we will learn “How to plot points in matplotlib with Python”. For this, we have to implement two popular modules of Python in the field of plotting graph or figure named “matplotlib” and “numpy“. The main motto of this article is to learn how to plot any point or any graph(scattered point of graph) in matplotlib using Python.
Plotting of points in matplotlib with Python
There is a method named as “scatter(X,Y)” which is used to plot any points in matplotlib using Python, where X is data of x-axis and Y is data of y-axis.
Let’s understand this with some example:-
# importing two required module import numpy as np import matplotlib.pyplot as plt # Creating a numpy array X = np.array([1]) Y = np.array([5]) # Plotting point using sactter method plt.scatter(X,Y) plt.show()
In the above example, the first step is to import two modules of Python named as numpy and matplotlib by these two lines of codes:-
and then we created a numpy array and stored in a variable named as X and then created another numpy array and stored this in another variable named as Y. We stored only one value in X and Y, since we have to plot a single point in this example. Then we used the “plt.scatter(X,Y)” and “plt.show()” to plot that required point.
# importing two required module import numpy as np import matplotlib.pyplot as plt # Creating a numpy array X = np.array([1,2,3,-1,-2]) Y = np.array([6,1,-4,2,5]) # Plotting point using scatter method plt.scatter(X,Y) plt.show()
The explanation for the above example is the same as the first example, the only difference is that we stored more than one variable in X and Y, since we have to plot more than one point.
# importing two required module import numpy as np import matplotlib.pyplot as plt # Taking points on x-axis from 0 to 10 and the last argument 30 is stating that 10 is divided into thirty equal interval. x = np.linspace(0,10,30) # y is a sine function y = np.sin(x) # Plotting point using scatter method plt.scatter(x, y,color="black") plt.show()
In the above example again the explanation is the same as explained above, the only difference is that we used a new method “np.linspace(0,10,30)“. This method is used to divide an equal interval between two points.
Let’s understand with an example:-
Let say we used “np.linspace(0,10,30)” this means that we are dividing 0-10 interval into 30 equal interval. So, there are 30 points located in above plot.
You may also read these related articles:-
Matplotlib Plotting
The plot() function is used to draw points (markers) in a diagram.
By default, the plot() function draws a line from point to point.
The function takes parameters for specifying points in the diagram.
Parameter 1 is an array containing the points on the x-axis.
Parameter 2 is an array containing the points on the y-axis.
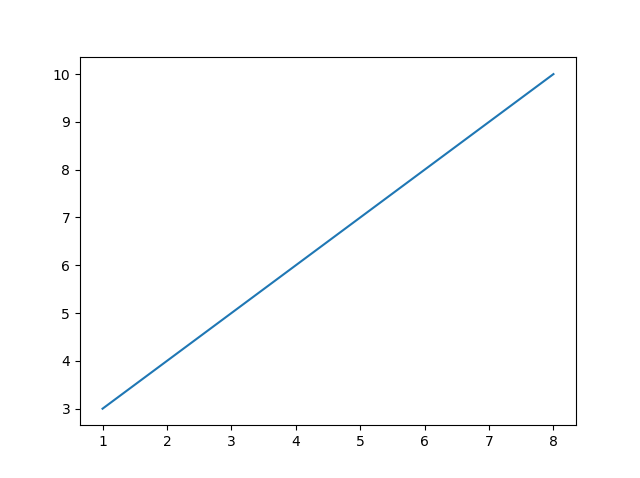
If we need to plot a line from (1, 3) to (8, 10), we have to pass two arrays [1, 8] and [3, 10] to the plot function.
Example
Draw a line in a diagram from position (1, 3) to position (8, 10):
import matplotlib.pyplot as plt
import numpy as np
xpoints = np.array([1, 8])
ypoints = np.array([3, 10])
plt.plot(xpoints, ypoints)
plt.show()
Result:
The x-axis is the horizontal axis.
The y-axis is the vertical axis.
Plotting Without Line
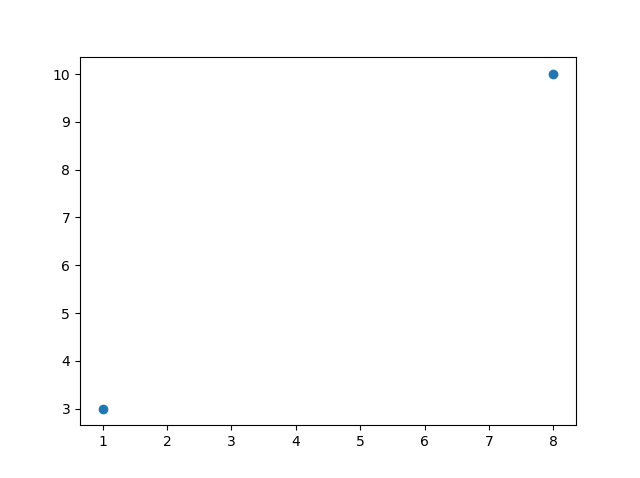
To plot only the markers, you can use shortcut string notation parameter ‘o’, which means ‘rings’.
Example
Draw two points in the diagram, one at position (1, 3) and one in position (8, 10):
import matplotlib.pyplot as plt
import numpy as np
xpoints = np.array([1, 8])
ypoints = np.array([3, 10])
plt.plot(xpoints, ypoints, ‘o’)
plt.show()
Result:
You will learn more about markers in the next chapter.
Multiple Points
You can plot as many points as you like, just make sure you have the same number of points in both axis.
Example
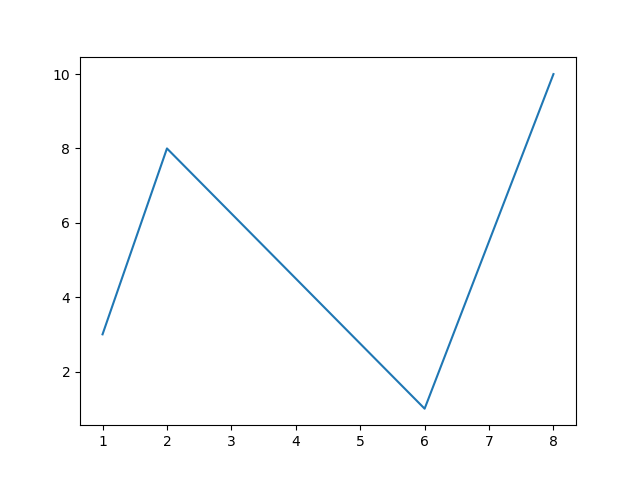
Draw a line in a diagram from position (1, 3) to (2, 8) then to (6, 1) and finally to position (8, 10):
import matplotlib.pyplot as plt
import numpy as np
xpoints = np.array([1, 2, 6, 8])
ypoints = np.array([3, 8, 1, 10])
plt.plot(xpoints, ypoints)
plt.show()
Result:
Default X-Points
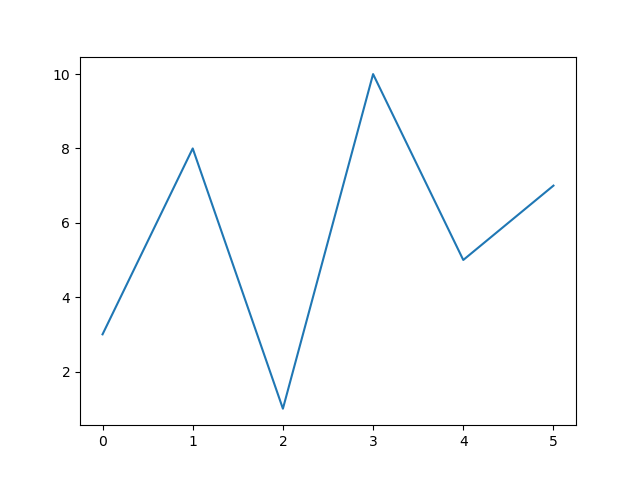
If we do not specify the points on the x-axis, they will get the default values 0, 1, 2, 3 (etc., depending on the length of the y-points.
So, if we take the same example as above, and leave out the x-points, the diagram will look like this:
Example
import matplotlib.pyplot as plt
import numpy as np
ypoints = np.array([3, 8, 1, 10, 5, 7])
Result:
The x-points in the example above are [0, 1, 2, 3, 4, 5].
Python Matplotlib How to Plot Points
This is our third article in Python Matplotlib, in this article we are going to learn Matplotlib How to Plot Points. also we can call it scatter plot. you can read the previous article for Python Matplotlib in the below links.
Matplotlib Tutorials For Beginners
So now this is the code for plotting points.
OK in the above code you can see that first of all we have imported our required classes, basically we are using matplotlib and also numpy. The function plt.scatter() works exactly like plt.plot(), taking the x and y coordinates of points as input parameters. However, each point is simply shown with one marker. and there are different optional parameters that you can use with this function. by playing with its many optional parameters, we can achieve many different effects like Colors and Styles.
If you run the code this will be the result.
We can control the colors used for a scatter plot. now let’s just customize the colors for the scatter plot. there are two options for pyplot.scatter() for controlling of dot colors through it’s color parameter, or it’s shortcut c.
- Common color for all the dots: If the color parameter is a valid matplotlib color definition, then all the dots will appear in that color.
- Individual color for each dot: If the color parameter is a sequence of a valid matplotlib color definition, the ith dot will appear in the ith color. Of course, we have to give the required colors for each dot.
OK now this is the code for changing of dots color.


