- Debug a PHP CLI script
- Start a debugging session from PhpStorm
- Create a Run/Debug Configuration
- Create a Run/Debug configuration for a PHP script manually
- Generate a Run/Debug configuration for a PHP script
- Launch the Debugger
- Switch between configured PHP interpreters on the fly
- Start a debugging session from the command line
- Listening for incoming debugger connections
- Start the script with debugger options
- Starting the script with Xdebug
- Start the script with debugging using PHP command-line switches
- Start the script with debugging using an environment variable
- Starting the script with Zend Debugger
- Start the script with debugging
- Debug
- Run applications
- Switch between configured PHP interpreters on the fly
- Quick way
- Run a single script
- Run the current file
- Customizable way
- Use a run/debug configuration
- Open a file in a web browser
- Re-run applications
- Stop and pause applications
- Stop a program
- Pause a program
- Show running processes
Debug a PHP CLI script
PHP applications are not always web applications. Various command line tools, daemons, message queue processing applications and other types of applications typically run in the PHP CLI. There are several ways to start a PHP CLI debugging session. You can start it from within PhpStorm and make it start the script and attach the debugger to it. Alternatively, you can let PhpStorm listen for incoming debugger connections and start the script outside the IDE. We’ll take a look at both options.
Before you start debugging, make sure that you have a debugging engine installed and configured properly. PhpStorm supports debugging with two most popular tools: Xdebug and Zend Debugger. These tools cannot be used simultaneously because they block each other. To avoid this problem, you need to update the corresponding sections in the php.ini file as described in Configure Xdebug and Configure Zend Debugger.
Open the active php.ini file in the editor:
- In the Settings dialog ( Ctrl+Alt+S ), click PHP .
- On the PHP page that opens, click next to the CLI Interpreter field.
- In the CLI Interpreters dialog that opens, the Configuration file read-only field shows the path to the active php.ini file. Click Open in Editor .
Start a debugging session from PhpStorm
To start debugging a PHP CLI script from within PhpStorm, perform the following steps.
Create a Run/Debug Configuration
PhpStorm uses Run/Debug configurations to execute a script from within the IDE. A configuration can define additional arguments for the PHP interpreter as well as launch other commands prior to starting our script. We will need a Run/Debug configuration to start the debugger from within PhpStorm.
Create a Run/Debug configuration for a PHP script manually
- Create a new Run/Debug configuration using the Run | Edit Configurations menu.
- Add a new configuration of the PHP Script type and provide the required parameters, such as the script to be executed.
- Save the created Run/Debug configuration.
Generate a Run/Debug configuration for a PHP script
- Right-click in the Project tool window, and select Debug | .php from the context menu (make sure to pick the item marked with ). Alternatively, open the script in the editor, press Alt+Shift+F9 , and select the script to be debugged. The IDE will launch the script with the debugger enabled, and open the Debug tool window.
Launch the Debugger
Before launching the debugger, make sure that either a breakpoint is set or the Break at first line in PHP scripts option is enabled on the Debug page of the Settings dialog Ctrl+Alt+S .
- Click on the PhpStorm toolbar.
- Press Alt+Shift+F9 .
- Select Run | Debug from the main menu.
Switch between configured PHP interpreters on the fly
- Press Ctrl+Shift+A and start typing Change PHP interpreter . In the suggestions list, select the Change PHP interpreter action. If necessary, you can assign a keyboard shortcut for this action either directly in the suggestions list by pressing Alt+Enter , or at a later point as described in Keyboard shortcuts.
- In the popup menu that opens, select one of the configured local or remote PHP interpreters.
The selected interpreter will be set as the default project interpreter on the PHP page of the Settings dialog ( Ctrl+Alt+S ). This will also affect configurations that use the default project interpreter (test frameworks’, quality tools’, and run/debug configurations) and commands run in the PhpStorm terminal.
Start a debugging session from the command line
Before you start a debugging session with PhpStorm when running CLI scripts, make sure that any of the following requirements is met:
- Xdebug’s remote_autostart (for Xdebug 2) or start_with_request (for Xdebug 3) option is enabled.
- XDEBUG_CONFIG environment variable exists.
Listening for incoming debugger connections
In PhpStorm, enable listening to incoming debug connections by either clicking on the toolbar or selecting Run | Start Listening for PHP Debug Connections . This will ensure PhpStorm reacts when a debugging session is started and opens the debug tool window automatically. Before launching the script, make sure that either a breakpoint is set or the Break at first line in PHP scripts option is enabled on the Debug page of the Settings dialog Ctrl+Alt+S .
Start the script with debugger options
Since we’ll be starting the script from the command line, we will have to make sure it is started with the required settings to enable the debugger.
Starting the script with Xdebug
Xdebug has various configuration options which we can use to let the PHP interpreter reach out to PhpStorm. These parameters have to be passed to the PHP interpreter using the -d command line parameter. Alternatively, you can set an environment variable so that you don’t need to provide the -d parameters every time.
Start the script with debugging using PHP command-line switches
php -dxdebug.mode=debug -dxdebug.client_host=127.0.0.1 -dxdebug.client_port=9003 -dxdebug.start_with_request=yes path/to/script.php
php -dxdebug.remote_enable=1 -dxdebug.remote_mode=req -dxdebug.remote_port=9000 -dxdebug.remote_host=127.0.0.1 -dxdebug.remote_connect_back=0 path/to/script.php
Start the script with debugging using an environment variable
set XDEBUG_CONFIG=remote_enable=1 remote_mode=req remote_host=127.0.0.1 remote_port=9000 remote_connect_back=0
export XDEBUG_CONFIG=»remote_enable=1 remote_mode=req remote_host=127.0.0.1 remote_port=9000 remote_connect_back=0″
Starting the script with Zend Debugger
Zend Debugger has various configuration options which we can use to let the PHP interpreter reach out to PhpStorm. These parameters have to be passed to the PHP interpreter using an environment variable.
Start the script with debugging
Optionally, to tell PhpStorm which path mapping configuration should be used for a connection from a certain machine, the value of the PHP_IDE_CONFIG environment variable should be set to serverName=SomeName , where SomeName is the name of the server configured on the PHP | Servers page of the Settings dialog ( Ctrl+Alt+S ).
If this environment variable is not set, you’ll be prompted to specify path mappings manually once IDE detects an incoming Xdebug connection.
Debug
Once the script is started, PhpStorm will open the Debug tool window and break at the first breakpoint that was set in the script. You can now continue debugging a PHP CLI script as described in Examine a suspended program.
If the script that is being debugged is not a part of the project that’s open in PhpStorm, the IDE will still open the script in the editor and pause execution at the first statement. This makes it possible to quickly debug any PHP CLI script, even if there is no PhpStorm project for it yet.
Run applications
To be able to run an application from PhpStorm, you first need to configure a PHP interpreter as described in Configure local PHP interpreters and Configure remote PHP interpreters. After that, you can do any of the following:
Switch between configured PHP interpreters on the fly
- Press Ctrl+Shift+A and start typing Change PHP interpreter . In the suggestions list, select the Change PHP interpreter action. If necessary, you can assign a keyboard shortcut for this action either directly in the suggestions list by pressing Alt+Enter , or at a later point as described in Keyboard shortcuts.
- In the popup menu that opens, select one of the configured local or remote PHP interpreters.
The selected interpreter will be set as the default project interpreter on the PHP page of the Settings dialog ( Ctrl+Alt+S ). This will also affect configurations that use the default project interpreter (test frameworks’, quality tools’, and run/debug configurations) and commands run in the PhpStorm terminal.
Quick way
Run a single script
If you are not going to pass any parameters to your program, and your program does not require any specific actions to be performed before start, you can run it right from the editor.
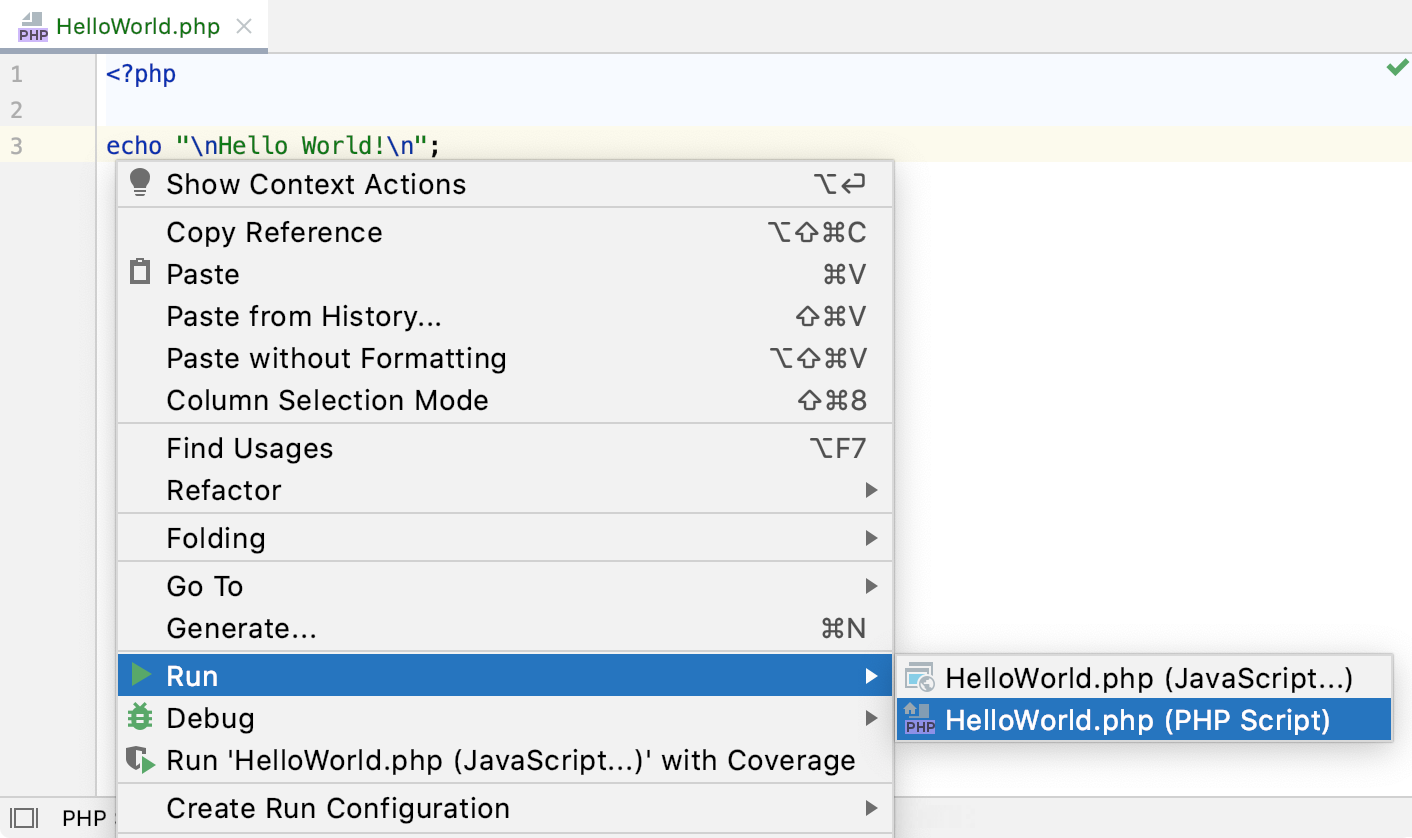
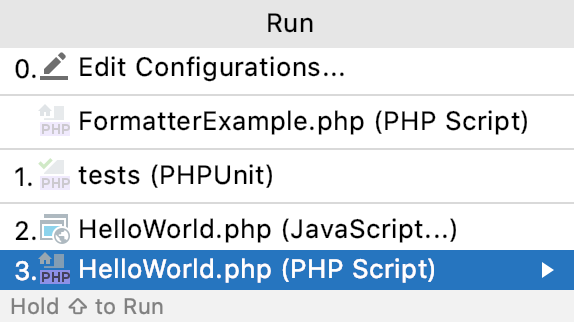
- Right-click in the code editor, select Run from the context menu, and then select from the submenu.
- To run a script, open it in the editor or select it in the Project tool window, and then select Run from the context menu.
The script will run, and a temporary run/debug configuration will be created for it.
Run the current file
On top of running applications from the editor, you can run single files using a dedicated option on the toolbar. The run and debug buttons are active and allow you to instantly run the currently opened file.
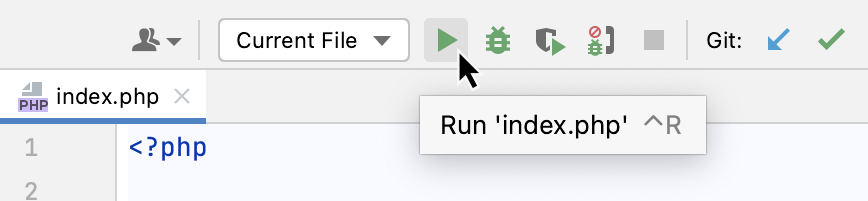
- In the editor, open the file that you want to run.
- Click next to the Current File option on the toolbar.
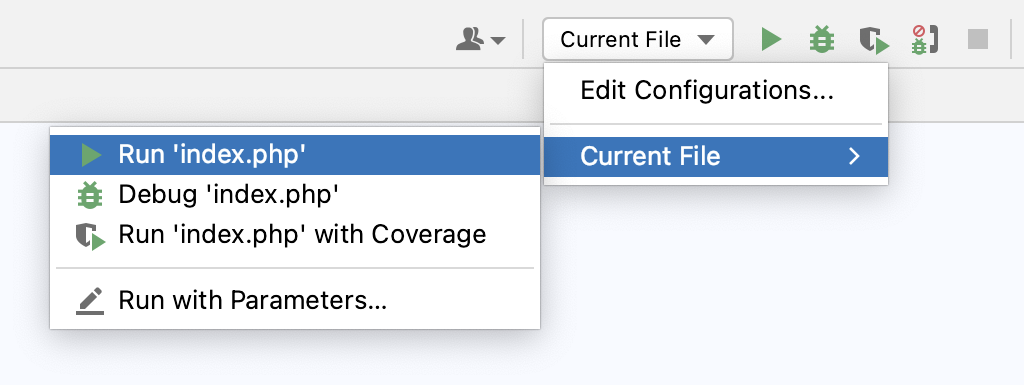
You can access other runners from the submenu as well: expand the list and click the right arrow next to Current File . From the menu that opens, you can debug the code, run it with coverage, or open the run configuration to specify more options.
Customizable way
Use a run/debug configuration
If you are going to pass parameters to your program or otherwise customize the startup of your program, use a run/debug configuration.
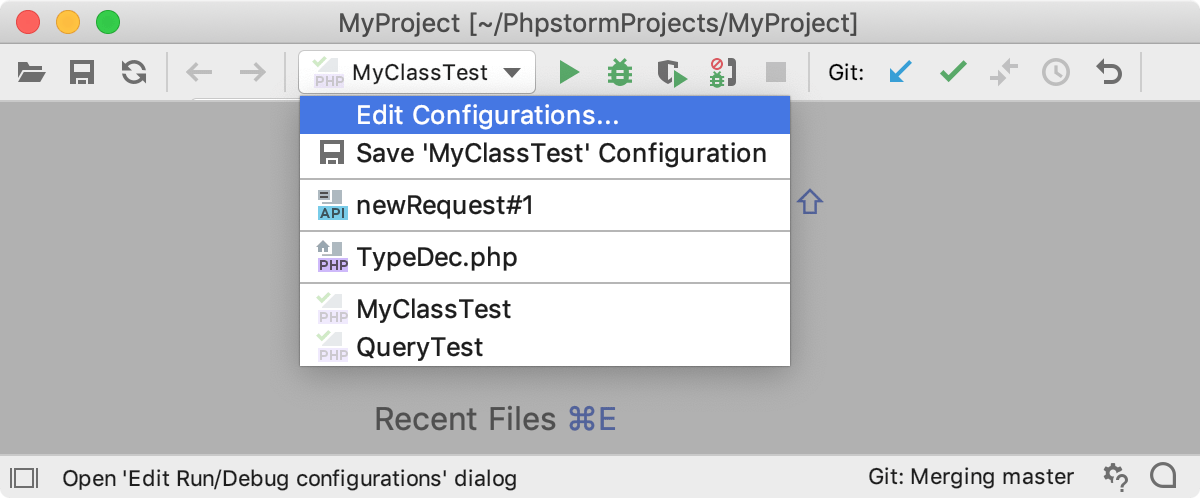
- Create a run/debug configuration.
- On the main toolbar, select the run/debug configuration you are going to use.

- Click or press Shift+F10 . Alternatively, press Alt+Shift+F10 , select the desired run configuration from the list, and press Enter .
 To switch between running and debugging, press and hold Shift when selecting the configuration.
When the application starts, you can view its output and interact with it in the Run tool window. Every run/debug configuration creates a separate tab when you run it.
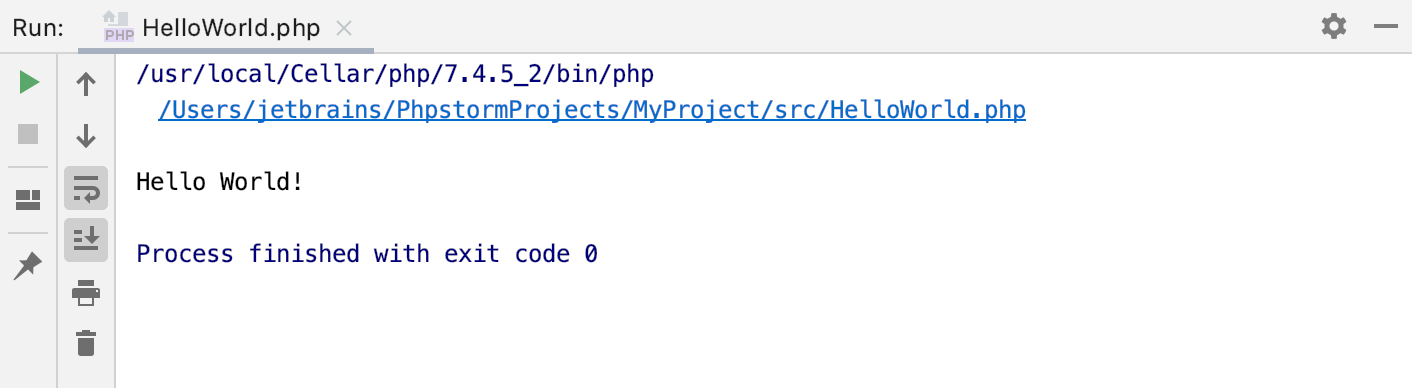
Use the Ctrl+F shortcut to search for text occurrences in the console output.
To learn more about tool windows and how to manage them, see the Tool windows topic.
Open a file in a web browser
PhpStorm has a built-in web server that can be used to preview and debug your application. This server is always running and does not require any manual configuration. All the project files are served on the built-in server with the root URL http://localhost:/ , with respect to the project structure.
The built-in server can only serve static content like HTML, JavaScript and CSS. To use it with PHP files, you need a local PHP interpreter specified for your project. When the interpreter is configured, PhpStorm will automatically start the PHP Built-In Web Server and redirect all PHP requests to it as soon as you run your PHP application.
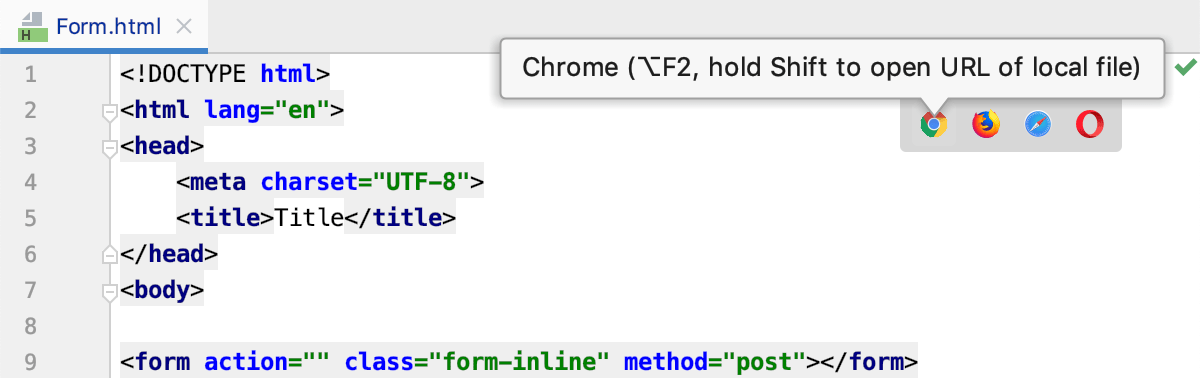
To open a file that is intended to be rendered by a web browser (HTML, XML, JSP, and so on), do one of the following:
- Press Alt+F2 .
- Right-click a file and select Open in Browser .
- From the main menu, select View | Open in Browser .
- Use the browser popup in the top right part of the editor window. Click the browser button to open the web server file URL, or Shift+Click it to open the local file URL.
The Open in Browser action is not available for other file types. However, you can still execute it using Find Action Ctrl+Shift+A .
Re-run applications
If you re-run an application, the output of the previous run is lost. To preserve the output of an application, click the Pin Tab button on the toolbar of the Run tool window. When a tab is pinned, new sessions are opened in another tab.
Stop and pause applications
When you stop a program, its process is interrupted and exits immediately. When you pause a program, it continues running in the background, but its output is suspended.
Stop a program
- In the Run tool window, click on the toolbar. Alternatively, press Ctrl+F2 and select the process to stop.
Pause a program
- Right-click in the Run tool window and select Pause Output from the context menu. Use the same toggle to resume the program.
Only the output is suspended. Pausing the output does not affect the execution of the program.
Show running processes
You can view the list of all active run or debug sessions and navigate between them.
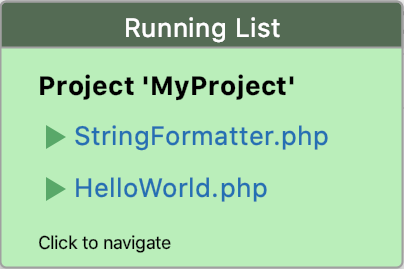
- From the main menu, select Run | Show Running List . In the top-right corner of the editor, PhpStorm shows a list with all active applications.