Monitor your Java on Linux with jconsole

The Java Development Kit (JDK) provides binaries, tools, and compilers for the development of Java applications. One helpful tool included is jconsole.
To demonstrate, I will use the WildFly J2EE application server, which is part of the JBOSS open source application server project. First, I start up a standalone instance.
~/wildfly/24.0.1/bin$ ./standalone.sh ========================================================================= JBoss Bootstrap Environment JBOSS_HOME: /home/alan/wildfly/24.0.1 JAVA: /usr/lib/jvm/java-11-openjdk-11.0.11.0.9-5.fc34.x86_64/bin/java Now, in another terminal, I type jconsole .
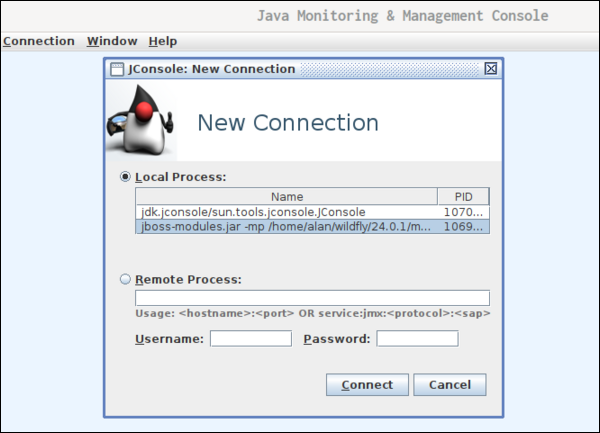
Upon launching, jconsole lists local instances. Select Local Process, then select the name of the process and click Connect. That is all it takes to connect and begin using jconsole with a running Java Virtual Machine (JVM).
Overview
The Java Monitoring and Management Console shows the process identifier (PID) at the top of the dashboard. The Overview tab has four graphs to show the vitals for Heap Memory Usage, Threads, Classes, and CPU Usage.