Embed Matplotlib Graphs in Tkinter GUI
Matplotlib is a famous Plotting Library in Python, while Tkinter is a popular GUI library in Python. While working with Tkinter, we might wonder how we can integrate (also known as “embed”) Matplotlib graphs into our Tkinter applications. Luckily for us, there is a really easy way of doing so, as Matplotlib has provided built-in functionality to allow it to be integrated with Tkinter.
In this tutorial we will be discussing these “features” and showing you how to use the full range of Matplotlib’s plotting features inside a Tkinter application.
Plotting Matplotlib Graphs in Tkinter
There are two Classes that Matplotlib provides us that allow it to be integrated with Tkinter. The first one, called FigureCanvasTkAgg is a special type of “canvas” object which can be used by Tkinter in place of its regular Canvas widget. FigureCanvasTkAgg is compatible with both Tkinter commands and Matplotlib plotting functions.
The second Class is navigationtoolbar2tk which integrates the Matplotlib Navigation Toolbar into Tkinter. We will discuss this Class further at a later point in this tutorial.
First lets explore how to setup FigureCanvasTkAgg and display a simple graph in a Tkinter application using matplotlib.
Embed Matplotlib Canvas in Tkinter
Lets start off with a basic Tkinter application with a single Tkinter widget.
import matplotlib.pyplot as plt import tkinter as tk # Initialize Tkinter root = tk.Tk() # Tkinter Application frame = tk.Frame(root) label = tk.Label(text = "Matplotlib + Tkinter!") label.config(font=("Courier", 32)) label.pack() frame.pack() root.mainloop() Now lets begin integrating the Matplotlib code into this. Most importantly, we need to make a few new imports, and create the Matplotlib Figure and Axis object.
The actual plotting will take place on the Matplotlib Figure and Axis (like it always does). The FigureCanvasTkAgg merely displays the plot in Tkinter.
Here we have made two new imports. One for the FigureCanvasTkAgg, and one for Numpy (since we need it for generating data).
import matplotlib.pyplot as plt from matplotlib.backends.backend_tkagg import ( FigureCanvasTkAgg, NavigationToolbar2Tk) import tkinter as tk import numpy as np
Next we initialize the Figure and Axis.
# Initialize Tkinter and Matplotlib Figure root = tk.Tk() fig, ax = plt.subplots()
Now onto the main subject of todays tutorial. Here we need to create our canvas object first. It takes two parameters, the first being the Matplotlib figure we created in the last step, and the Tkinter root object (which represents our Tkinter application).
# Create Canvas canvas = FigureCanvasTkAgg(fig, master=root) canvas.get_tk_widget().pack(side=tk.TOP, fill=tk.BOTH, expand=1)
Whenever we want to perform a Tkinter-based operation on the Canvas, we need to call get_tk_widget() first. We needed to do this in the above code to properly pack it in. We also enabled the expand and fill options, as it is good for a Canvas to be able to resize itself (generally).
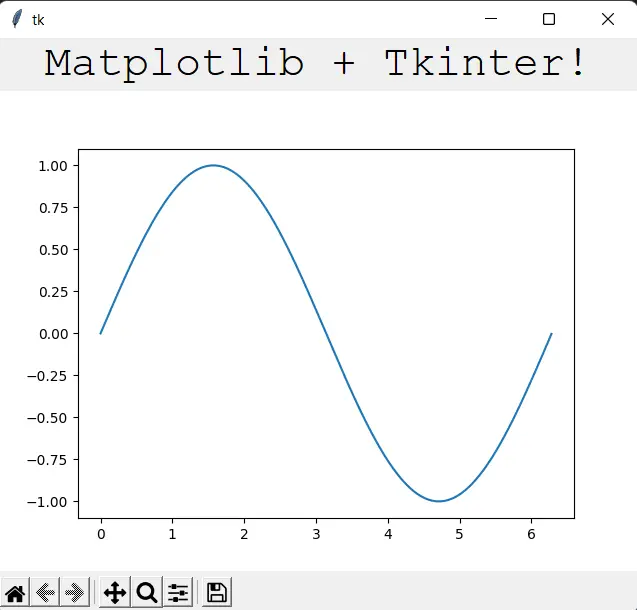
Finally, we will plot the data and call the draw() function on the canvas object. If you do not call the draw() function, the changes will not update on the Canvas.
# Plot data on Matplotlib Figure t = np.arange(0, 2*np.pi, .01) ax.plot(t, np.sin(t)) canvas.draw()
import matplotlib.pyplot as plt from matplotlib.backends.backend_tkagg import ( FigureCanvasTkAgg) import tkinter as tk import numpy as np # Initialize Tkinter and Matplotlib Figure root = tk.Tk() fig, ax = plt.subplots() # Tkinter Application frame = tk.Frame(root) label = tk.Label(text = "Matplotlib + Tkinter!") label.config(font=("Courier", 32)) label.pack() frame.pack() # Create Canvas canvas = FigureCanvasTkAgg(fig, master=root) canvas.get_tk_widget().pack(side=tk.TOP, fill=tk.BOTH, expand=1) # Plot data on Matplotlib Figure t = np.arange(0, 2*np.pi, .01) ax.plot(t, np.sin(t)) canvas.draw() root.mainloop() 
Embed Navigation Toolbar in Tkinter
There is still one thing missing in our Matplotlib/Tkinter Application. We are missing the navigational toolbar that appears by default in all Matplotlib Figure windows near the bottom.
Time to make a new import, and add this feature to our graph from earlier!
from matplotlib.backends.backend_tkagg import ( FigureCanvasTkAgg, NavigationToolbar2Tk)
Next we just have to create our toolbar in the following manner.
# Create Toolbar toolbar = NavigationToolbar2Tk(canvas, root, pack_toolbar=False) toolbar.update() toolbar.pack(side=tk.BOTTOM, fill=tk.X)
Don’t forget to pack the toolbar at the bottom, otherwise it will look out of place. Allowing it to expand horizontally is also a good UI choice.
This marks the end of the Embed Matplotlib Graphs in Tkinter Tutorial. Any suggestions or contributions for CodersLegacy are more than welcome. Questions regarding the tutorial content can be asked in the comments section below.
Using Tkinter and Matplotlib
Recently I was working on a project in which I needed to quickly visualize groups of 2D data points. As the project was in Python, I thought the well-established libraries Tkinter and matplotlib would be useful for this task. Unfortunately, I had to hunt through many sources to figure out how to use these two libraries together, so I am writing this blog post to help others who may have similar needs.
Below is the result from our project:

As you can see we have displayed three groups of data points, each in a different color.
First we will look at setting up the matplotlib environment in Tkinter . Here is a minimal set of necessary import statements.
from tkinter import * from tkinter.ttk import * import matplotlib matplotlib.use("TkAgg") from matplotlib.figure import Figure from matplotlib.backends.backend_tkagg import FigureCanvasTkAgg For the purposes of this blog post we will create a window with nothing but the matplotlib canvas to make things simpler. Suppose our Tkinter application consists of nothing but the following:
Now we can start creating the matplotlib canvas.
figure = Figure(figsize=(5, 4), dpi=100) plot = figure.add_subplot(1, 1, 1) There are some options which can be configured here, such as figsize which takes a width by height in inches, and the dpi. We can specify the position of the subplot, here we use (1, 1, 1) as the top-left corner, which will cause the subplot to take up the entire figure.
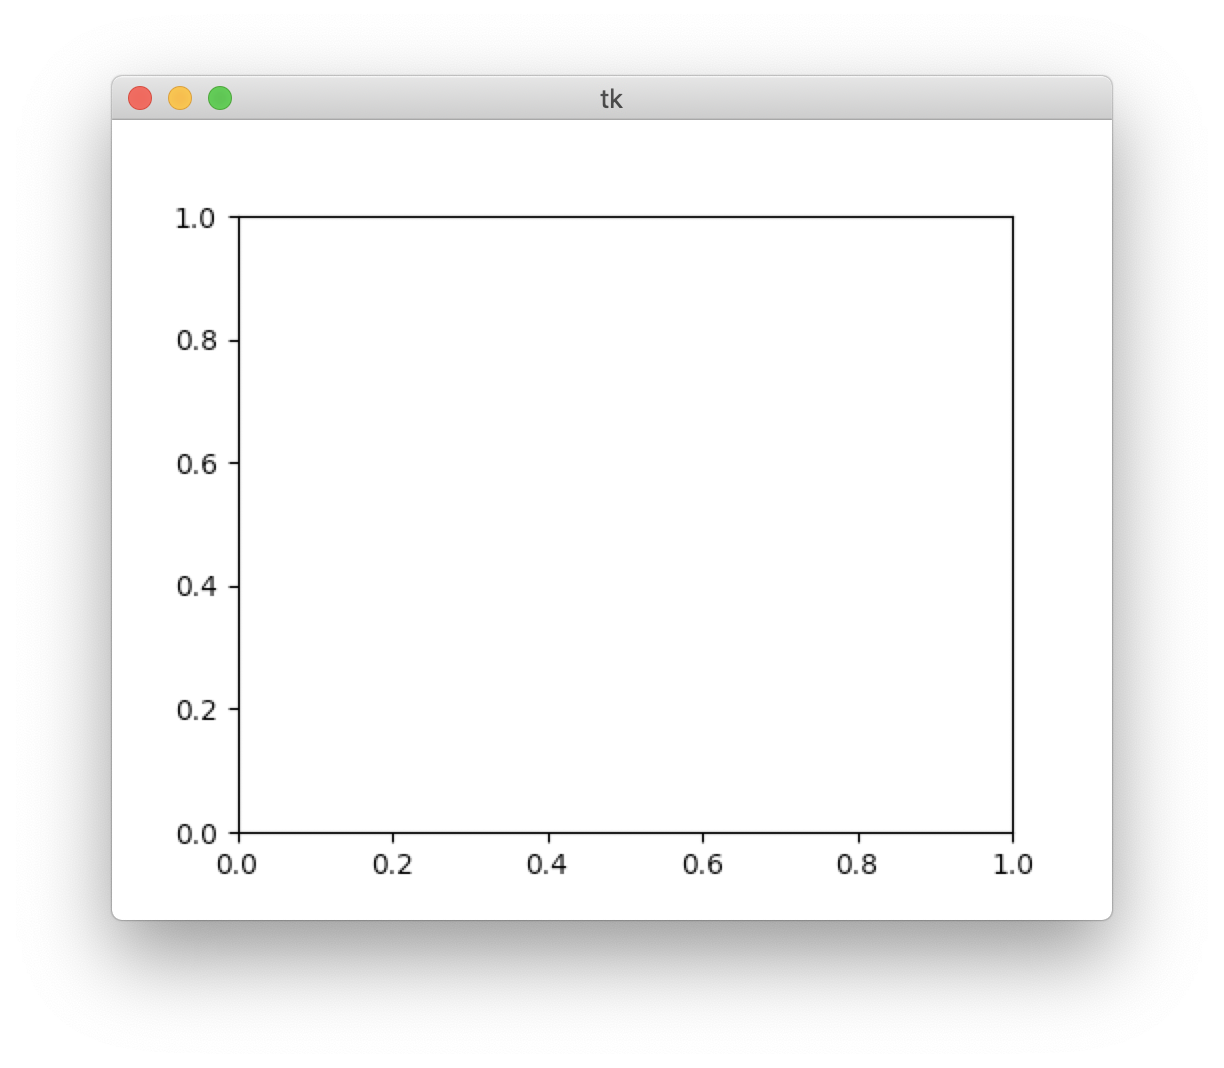
This doesn’t draw anything to screen yet, in order to do that we need to create an instance of FigureCanvasTkAgg . To the best of my knowledge we will need to do this every time we finish updating the canvas.
canvas = FigureCanvasTkAgg(figure, root) canvas.get_tk_widget().grid(row=0, column=0) Then of course to begin the application
The code up to this point will draw a blank graph, like this:
Now we can start plotting points on our graph. To do so, we use the plot method on the subplot we created earlier
plot.plot(0.5, 0.3, color="#C41E3A", marker="o", linestyle="") This will plot a single point at coordinates (0.5, 0.3) . We can also plot multiple points at once by passing separate lists of x and y values.
x = [ 0.1, 0.2, 0.3 ] y = [ -0.1, -0.2, -0.3 ] plot.plot(x, y, color="blue", marker="x", linestyle="") This will plot the points (0.1, -0.1) , (0.2, -0.2) , and (0.3, -0.3) . For colors, matplotlib features a few built in colors which can be seen here, or you can specify then as a hex triplet. There are many different marker styles to choose from, here is a full list. Finally, by default, matplotlib will connect all points we plot, but we can turn this off by passing an empty linestyle .
Here we drew our points all at once, but if we had drawn them dynamically (e.g. as a result of pressing a button) we would have needed to create the FigureCanvasTkAgg object again and regrid it, as demonstrated above.
So the final code for our graph application:
from tkinter import * from tkinter.ttk import * import matplotlib matplotlib.use("TkAgg") from matplotlib.figure import Figure from matplotlib.backends.backend_tkagg import FigureCanvasTkAgg root = Tk() figure = Figure(figsize=(5, 4), dpi=100) plot = figure.add_subplot(1, 1, 1) plot.plot(0.5, 0.3, color="red", marker="o", linestyle="") x = [ 0.1, 0.2, 0.3 ] y = [ -0.1, -0.2, -0.3 ] plot.plot(x, y, color="blue", marker="x", linestyle="") canvas = FigureCanvasTkAgg(figure, root) canvas.get_tk_widget().grid(row=0, column=0) root.mainloop() 
So that is a quick, simple, and customizable way of visualizing data.
Tkinter Matplotlib
Summary: in this tutorial, you’ll learn how to display a graph from the Matplotlib library on a Tkinter application.
Display a bar chart from matplotlib in Tkinter applications
Matplotlib is a third-party library for creating professional visualizations in Python. Since Matplotlib is a third-party library, you need to install it before use.
To install the matplotlib package, you can use the following pip command:
pip install matplotlibCode language: Python (python)The following program uses the matplotlib to create a bar chart that shows the top five programming languages by popularity.
import tkinter as tk import matplotlib matplotlib.use('TkAgg') from matplotlib.figure import Figure from matplotlib.backends.backend_tkagg import ( FigureCanvasTkAgg, NavigationToolbar2Tk ) class App(tk.Tk): def __init__(self): super().__init__() self.title('Tkinter Matplotlib Demo') # prepare data data = < 'Python': 11.27, 'C': 11.16, 'Java': 10.46, 'C++': 7.5, 'C#': 5.26 > languages = data.keys() popularity = data.values() # create a figure figure = Figure(figsize=(6, 4), dpi=100) # create FigureCanvasTkAgg object figure_canvas = FigureCanvasTkAgg(figure, self) # create the toolbar NavigationToolbar2Tk(figure_canvas, self) # create axes axes = figure.add_subplot() # create the barchart axes.bar(languages, popularity) axes.set_title('Top 5 Programming Languages') axes.set_ylabel('Popularity') figure_canvas.get_tk_widget().pack(side=tk.TOP, fill=tk.BOTH, expand=1) if __name__ == '__main__': app = App() app.mainloop()Code language: Python (python)
First, import the matplotlib module
import matplotlibCode language: Python (python)and call the use() function to tell which backend the matplotlib will use:
matplotlib.use('TkAgg')Code language: Python (python)In this case, we use TkAgg backend, which is made to integrate into Tkinter.
Second, import the following Figure , FigureCanvasTkAgg , and NavigationToolbar2Tk classes:
from matplotlib.figure import Figure from matplotlib.backends.backend_tkagg import ( FigureCanvasTkAgg, NavigationToolbar2Tk )Code language: Python (python)The Figure class represents the drawing area on which matplotlib charts will be drawn.
The FigureCanvasTkAgg class is an interface between the Figure and Tkinter Canvas .
The NavigationToolbar2Tk is a built-in toolbar for the figure on the graph.
Third, prepare the data for showing on the bar chart:
data = < 'Python': 11.27, 'C': 11.16, 'Java': 10.46, 'C++': 7.5, 'C#': 5.26 > languages = data.keys() popularity = data.values()Code language: Python (python)The data is a dictionary with the keys are the programming languages and values are their popularity in percentage.
Fourth, create a Figure to hold the chart:
figure = Figure(figsize=(6, 4), dpi=100)Code language: Python (python)The Figure object takes two arguments: size in inches and dots per inch (dpi). In this example, it creates a 600×400 pixel figure.
Fifth, create a FigureCanvasTkAgg object that connects the Figure object with a Tkinter’s Canvas object:
figure_canvas = FigureCanvasTkAgg(figure, self)Code language: Python (python)Note that the FigureCanvasTkAgg object is not a Canvas object but contains a Canvas object.
Sixth, create a matplotlib ‘s built-in toolbar:
NavigationToolbar2Tk(figure_canvas, self)Code language: Python (python)Seventh, add a subplot to the figure and return the axes of the subplot:
axes = figure.add_subplot()Code language: Python (python)Eighth, create a bar chart by calling the bar() method of the axes and passing the languages and popularity into it. Also, set the title and the label of the y-axis:
axes.bar(languages, popularity) axes.set_title('Top 5 Programming Languages') axes.set_ylabel('Popularity')Code language: Python (python)Finally, place the chart on the Tkinter’s root window:
figure_canvas.get_tk_widget().pack(side=tk.TOP, fill=tk.BOTH, expand=1)Code language: Python (python)