- How to Use “%matplotlib inline”: A Comprehensive Guide with Examples
- Introduction to Matplotlib
- Jupyter Notebooks and Matplotlib
- What is %matplotlib inline ?
- Why use %matplotlib inline ?
- Using %matplotlib inline
- Step 1: Starting Jupyter Notebook
- Step 2: Importing Matplotlib
- Step 3: Using %matplotlib inline
- Step 4: Creating Plots
- Alternative to %matplotlib inline
- Fine-Tuning Your Plots
- Conclusion
- Как использовать «%matplotlib inline» (с примерами)
- Пример: как использовать встроенный %matplotlibe
- Дополнительные ресурсы
- Использование %matplotlib inline в Python
- Что такое %matplotlib inline?
- Зачем она нужна?
- Как это работает?
- Вывод
How to Use “%matplotlib inline”: A Comprehensive Guide with Examples
%matplotlib inline is an essential command for anyone working with Jupyter Notebooks and plotting libraries such as Matplotlib. In this article, we will delve into the details of what %matplotlib inline does, why it is necessary, and how to use it effectively with various examples.
Introduction to Matplotlib
Before we dive into the usage of %matplotlib inline , let’s understand what Matplotlib is. Matplotlib is a powerful and widely-used plotting library for Python. It provides an object-oriented API for embedding plots into applications using general-purpose GUI toolkits like Tkinter, wxPython, or Qt, as well as an interface for generating plots as images or displaying them interactively.
Matplotlib is specifically good for creating static, animated, and interactive visualizations in Python. It’s highly customizable and allows you to create a wide range of plots, including line plots, scatter plots, bar plots, error bars, histograms, contour plots, quiver plots, etc.
Jupyter Notebooks and Matplotlib
Jupyter Notebook is an open-source web application that allows for the creation and sharing of documents that contain live code, equations, visualizations, and narrative text. It’s widely used for data cleaning, transformation, numerical simulations, statistical modeling, and machine learning.
When using Matplotlib within Jupyter Notebooks, you need a way to display the plots you create. This is where %matplotlib inline comes into play.
What is %matplotlib inline ?
%matplotlib inline is a magic command in Jupyter that enables the inline backend for usage with the IPython kernel. This backend is essentially an interface for rendering plots within the notebook itself. Without this command, your plots may be displayed in a new window. In environments such as Jupyter Notebooks, however, inline display is often more convenient.
It’s important to note that this command is specific to the Jupyter Notebook and Jupyter QtConsole. It doesn’t affect scripts, or the use of Matplotlib in other IDEs or applications.
Why use %matplotlib inline ?
Using %matplotlib inline has several benefits:
- Convenience: Your plots will be displayed inline, below the code cells that produced them. This makes it easier to view and understand the data and the corresponding visual representation.
- Notebook Compatibility: When sharing your Jupyter Notebook, the plots will be automatically included. This is especially useful if you are using Jupyter for reports or presentations.
- Customization: You can customize the plots even after they are rendered by simply tweaking the plotting code and running the cell again.
Now that we’ve covered the fundamentals, let’s delve into the practical aspect.
Using %matplotlib inline
Let’s get started by using %matplotlib inline in a Jupyter Notebook.
Step 1: Starting Jupyter Notebook
First, make sure you have both Jupyter Notebook and Matplotlib installed. You can install them using pip if you don’t have them:
pip install jupyter matplotlibAfter the installation, run Jupyter Notebook in terminal or command prompt.
This will open the Jupyter Notebook interface in your web browser.
Step 2: Importing Matplotlib
In your Jupyter Notebook, import Matplotlib. Typically, the pyplot module is imported under the alias plt :
import matplotlib.pyplot as pltStep 3: Using %matplotlib inline
Now, simply input the magic command %matplotlib inline in a code cell and run the cell:
That’s it! Any plot you create will now be displayed inline, below the code cell that created it.
Step 4: Creating Plots
Now you can start creating plots. Here is an example where we create a simple line plot.
import numpy as np # Data for plotting x = np.linspace(0, 10, 100) y = np.sin(x) # Creating the plot plt.plot(x, y, label='sin(x)') plt.xlabel('X Axis') plt.ylabel('Y Axis') plt.title('A Simple Line Plot') plt.legend() # Display the plot plt.show()This will display the plot directly below the cell.
Alternative to %matplotlib inline
While %matplotlib inline is very useful, there is another magic command that can be even more handy: %matplotlib notebook . This command enables the nbagg backend, which provides an interactive, zoom-able version of your plot, within the Jupyter Notebook.
Use it in the same way as %matplotlib inline :
Fine-Tuning Your Plots
You can further customize and fine-tune your plots using various functions available in Matplotlib. For example, you can add labels, titles, and legends; change colors and styles; and even combine several plots.
Here’s an example that shows a more complex plot:
%matplotlib inline import matplotlib.pyplot as plt import numpy as np # Data for plotting x = np.linspace(0, 10, 100) y1 = np.sin(x) y2 = np.cos(x) # Creating the first plot plt.figure(figsize=(10,5)) plt.plot(x, y1, label='sin(x)', color='blue', linestyle='dashed') plt.plot(x, y2, label='cos(x)', color='red', linestyle='dotted') # Adding labels, title, and legend plt.xlabel('X Axis') plt.ylabel('Y Axis') plt.title('Multiple Plots with Customizations') plt.legend() # Display the plot plt.show()Conclusion
%matplotlib inline is an incredibly useful magic command that makes working with Matplotlib in Jupyter Notebooks much more convenient. As we have seen, it’s simple to use and essential for displaying plots inline. Whether you are just getting started with data visualization or are a seasoned veteran, %matplotlib inline is likely to be an integral part of your workflow in Jupyter Notebooks.
Как использовать «%matplotlib inline» (с примерами)
Вы можете использовать следующий код для отображения и хранения графиков Matplotlib в блокноте Python Jupyter:
Вот как этот код описан на странице документации :
«Благодаря этому бэкэнду вывод команд построения графика отображается во внешних интерфейсах, таких как блокнот Jupyter , непосредственно под ячейкой кода, которая его создала. Полученные графики также будут сохранены в документе записной книжки».
В следующем примере показано, как использовать этот код на практике.
Пример: как использовать встроенный %matplotlibe
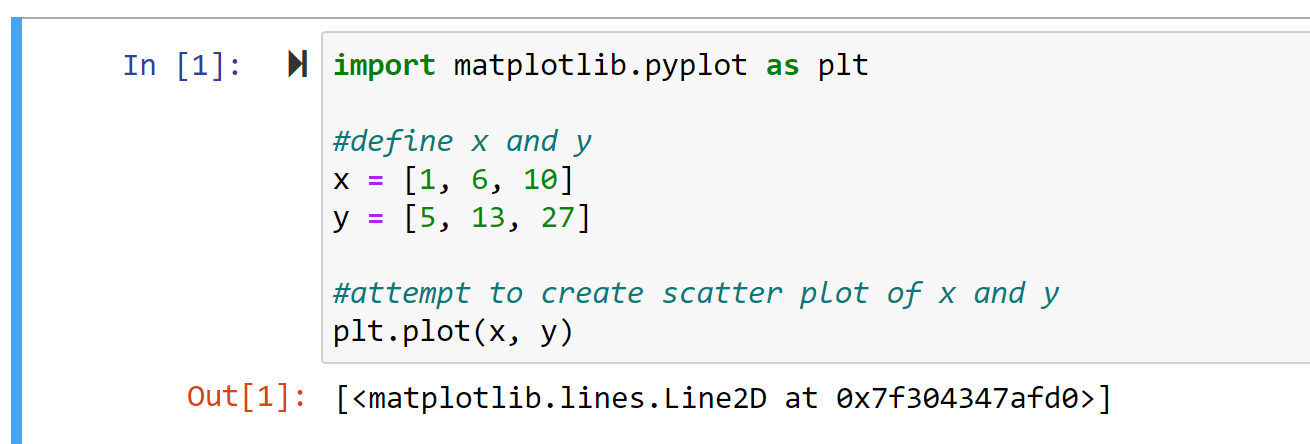
Предположим, мы пытаемся использовать следующий код для создания линейного графика Matplotlib в блокноте Jupyter:
import matplotlib.pyplot as plt #define x and y x = [1, 6, 10] y = [5, 13, 27] #attempt to create line plot of x and y plt.plot (x, y) Вот как выглядит вывод в блокноте Jupyter:

Код выполняется без ошибок, но линейный график не отображается вместе с кодом.
Чтобы исправить это, мы можем использовать встроенную команду %matplotlib перед созданием линейного графика:
% matplotlib inline import matplotlib.pyplot as plt #define x and y x = [1, 6, 10] y = [5, 13, 27] #create scatter plot of x and y plt.plot (x, y) Вот как выглядит вывод в блокноте Jupyter:

Обратите внимание, что код снова выполняется без ошибок, а график отображается в записной книжке.
Обратите внимание, что после того, как мы использовали %matplotlib inline , любые графики Matplotlib, которые мы создаем в любых будущих ячейках блокнота, также будут отображаться и храниться в блокноте.
Дополнительные ресурсы
В следующих руководствах объясняется, как выполнять другие распространенные операции в Python:
Использование %matplotlib inline в Python

В процессе изучения Python и библиотеки Matplotlib, которая используется для визуализации данных, часто встречается команда %matplotlib inline . Она может вызывать недоумение, поскольку выглядит иначе, по сравнению с большинством команд Python. Например, в следующем блоке кода:
import matplotlib.pyplot as plt import numpy as np %matplotlib inline x = np.linspace(0, 10, 100) plt.plot(x, np.sin(x)) plt.plot(x, np.cos(x)) plt.show()
Здесь команда %matplotlib inline может показаться загадочной. Что это и для чего она нужна?
Что такое %matplotlib inline?
%matplotlib inline — это команда, специфичная для IPython (или Jupyter notebook), которая позволяет вам встроить графики прямо внутрь ноутбука, а не в новом окне.
Зачем она нужна?
Когда вы работаете с Matplotlib в интерактивных режимах, таких как Jupyter notebook или IPython, графики, которые вы создаете, отображаются в отдельном окне. Это может быть неудобно, особенно если вы хотите сохранить свою работу в виде ноутбука с результирующими графиками.
Команда %matplotlib inline решает эту проблему, позволяя вам встроить графики прямо в ноутбук. Это удобно, поскольку позволяет сохранить все в одном месте, а также делиться своими ноутбуками с другими.
Как это работает?
%matplotlib inline является примером использования так называемых «магических» функций в IPython. «Магические» функции — это набор команд, предоставляемых IPython, которые имеют синтаксис, отличающийся от обычного синтаксиса Python. Эти функции начинаются с символа % или %% и предназначены для выполнения определенных операций.
В случае с %matplotlib inline , когда математическая библиотека выполняет команду для создания графика, «магическая» функция перехватывает вывод и встраивает его в ноутбук.
Вывод
Команда %matplotlib inline — это удобный инструмент для работы с графиками в интерактивном режиме Python. Она позволяет встроить графики прямо в ноутбук, что упрощает сохранение и обмен результатами работы.