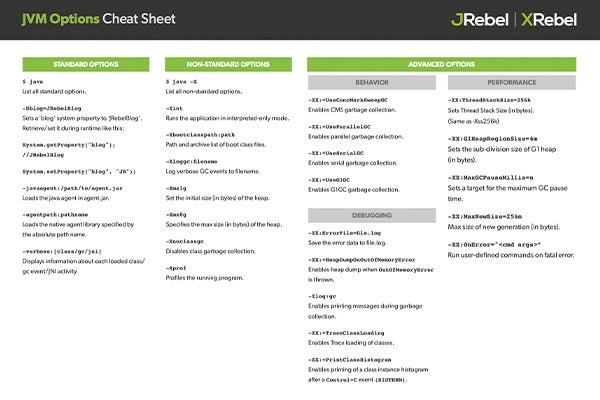
JVM Options Cheat Sheet
JVM and Java options can get confusing. That’s why we’ve compiled this one-page JVM options cheat sheet. It includes everything from standard options, to non-standard options, to advanced options for behavior, performance, and debugging.
In the content below, you can read detailed information on how to use these JVMs. Then download the cheat sheet at the bottom of the page to keep as a handy guide.
JVM Options Overview
There are three types of options that you can add to your JVM, standard, non-standard and advanced options. If you apply an advanced option, you always precede the option with -XX: . Similarly if you’re using a non-standard option, you’ll use -X . Standard options don’t prepend anything to the option. Let’s start with the standard options.
Standard Java Options
If you wanted to get a full list of the standard Java JVM command line options, simply type java at the command line without further parameters and you’ll see the usage statement followed by a wealth of standard Java options. For this cheat sheet, we’ve picked a few out that we find most interesting. First of all, we’ll start with the common system property. This can be set on JVM creation like so:
The -D flag states that the following name value pair should used as a system property within the JVM and can be programmatically retrieved as follows:
System.getProperty("blog"); //JRebelBlog The same system property could be created programmatically after the JVM has been created with the following code:
At JRebel, we simply love java agents. A java agent is like a JVM plugin, that utilizes the Instrumentation API. Interesting manipulations of bytecode can be achieved, leading to many amazing tools. To add a java agent, simply point to the path of the jar file that contains the agent code and manifest, as shown below.
If you need more information about the inner workings of your JVM during runtime you can make use of the -verbose option. You can use it in a number of flavors to gather information in different areas. These can include information about loaded classes ( class ), garbage collection ( gc ) and JNI ( jni ) activity. All additional information is sent to the standard output log.
Non-Standard Java JVM Options
Like the standard options, you’re able to retrieve the full list of non-standard JVM command line options by calling java -X at the command line. When the JVM starts, it uses a default bootstrap class path to search for bootstrap classes and resources. To override the default bootstrap class path, supply a list of paths and/or archives to the following JVM option.
You can also append or prepend the default bootstrap classpath by using commands -Xbootclasspath/a:path and -Xbootclasspath/p:path respectively. Are you fed up with your GC events being logged to standard out? Yes? Then this option is for you!
Set the -Xloggc option and supply a filename and you’re logging to whichever file you like! This option overrides the -verbose:gc option that was introduced in the last section.
The best way to avoid your JVM falling over in a heap, is to intentionally start out with a heap from the beginning. The question is, how big should that heap be? Well, it realistically depends on your applications and what you intend to do with your JVM. You should also look to change your heap sizes, measure, and repeat before settling on a final size. You can set both the initial and max size of your heap in bytes, using the usual k , m , g notation we’re probably all used to. The example JVM options below will start the JVM up with an initial 1 GB heap size, and allow it to grow up to a maximum of 8 GB if needed.
To disable garbage collection of classes, you can use the following option below. This can save you time during garbage collection, as only objects are eligible to be garbage collected. Of course there is an increased risk of running out of memory, particularly if you’re on a version of Java that uses a permanent generation space.
The final non-standard option we’ll talk about is one that allows you to profile your running JVM. Of course, it won’t be as fully featured or easy to understand as those profilers with nice UIs. However, it’s very easy to enable with the following option. All information goes to the standard output.
Advanced JVM Options
Behavior
We’ll start around the topic of garbage collection. In Java 9 the standard garbage collector will be Garbage First Garbage Collector (G1GC), although you can enforce any of the garbage collection strategies by electing to use them. These might include the Concurrent Mark Sweep (CMS) garbage collector, the parallel scavenge garbage collector, the serial garbage collector and of course G1GC. You can enable each by using the following options. Needless to say, don’t try and use multiple GC options for the same runtime.
-XX:+UseConcMarkSweepGC -XX:+UseParallelGC -XX:+UseSerialGC -XX:+UseG1GC -XX:+UseZGC
Debugging
If you would like to see your error data in a specific file, you may use the option below with the filename of the log file you wish to use. Now you can populate your nice clean log file with all your amazing errors.
There’s nothing more frustrating than when you try to debug an error without debug information. A good example of this is the familiar OutOfMemory error. This event will bring your JVM to its knees with next to no information as to why. There is help out there if you use this next option. The HeapDumpOnOutOfMemoryError option will give you a .hprof file with loads of debug information. You could open this file in Eclipse MAT or whatever tool you prefer and work out what is hogging your heap. It’s so detailed you can diagnose the problem right down to the very last object and primitive you might be leaking.
-XX:+HeapDumpOnOutOfMemoryError
If you’re desperate to understand when your garbage collector is doing its job, but don’t want the full verbosity of -verbose:gc , try the -Xlog:gc command (available for Java versions 9 and newer).
Are you curious when or if your classes are being loaded? If so, you might want to check out the next option. This option enables the tracing of every class loaded by the JVM. Helpful, if you’re into that kind of thing.
Performance
Did you know that the memory in your thread stack spaces are not allocated from the heap and are therefore not affected when you use the -Xms and -Xmx options. If you wanted to increase, or maybe even reduce the size of your thread stack spaces, you can do so by specifying the number of bytes like so.
If you’re using the G1GC, you should become familiar with region sizes and understand what’s best for your application. As with all options like this, try out different values, measure, and repeat.
The -Xms and -Xmx settings we mentioned earlier are applicable to the old generation heap only. In most JVMs, the Java heap space also contains a young generation, or nursery heap. To update the max size of the young generation, use the following option.
Additional Java Options Resources
Ready to download a copy of our JVM Options cheat sheet? Click the button below to download the PDF.
If you’re looking for additional Java cheat sheets and Java developer resources, you’re in luck. Check out our content hub full of handy resources you can download and/or print out for reference.
Conclusion
JVM is what keeps Java applications running by managing and optimizing the program on all devices and operating systems. What about when you make updates to your applications? JRebel is a JVM plugin that supports over 100 frameworks, reflecting code changes instantly, eliminating the painful redeployment process. See for yourself by trying it free for ten days.