- Debugging HTML Code
- Preventing errors
- Three Debugging tools for HTML
- 1) Inspecting the HTML source code
- What is the Browser Cache
- How to inspect the HTML source code:
- 2) Developer Tools Inspector
- 3) Debugging HTML inside your Coding Editor (IDE)
- HTML most common errors on how to debug them
- Unclosed tags
- Missing quotes
- Bad or tag url
- How to Debug your HTML and solve errors?
- Introduction to HTML
- Why is Debugging HTML important?
- Some Common HTML Errors
- Syntax errors
- Outlining elements
- Turning off styles
- Display type
- Cross-browser Compatibility issues
- Debugging HTML Errors with BrowserStack Live
Debugging HTML Code
HTML Code is difficult to debug initially, but it’s easy to grasp if you follow this recipe. You only need to know 2-3 things before starting to code or debug in HTML that will make you a master. Yes, it’s that easy, so don’t worry and keep reading.
If you are interested in debugging other languages or technologies where is our full guide about What is debugging and how to become a master in debugging when coding front end and backend web development.
Preventing errors
This guide is about fixing a bug, but it’s worth mentioning how to prevent the majority of the bugs in the first place: ABC = Always Be Closing the tags as a priority. If you open a tag
, close it immediately! Like this: , and then proceed to fill the inner HTML content. Use a code formatter that indents your code automatically. Most of the bugs at first come because your code is messy and challenging to follow with your eyes. You end up opening/closing tags in the wrong place.
Three Debugging tools for HTML
The most effective debugging tools for HTML are: Your page HTML source code as the browser sees it. The developer tools inspector. Your coding editor (VSCode, JetBrains, etc.).
Let’s go over each of them in detail.
1) Inspecting the HTML source code
You may assume that the code you wrote is the one being displayed by the website. NOPE! There are multiple reasons that your original code may not match the source code being used on the website.
- Browser Cache (the most common cause): Your browser sometimes keeps an old version on purpose.
- Server-side dynamic rendering: Using a server-side language to manipulate the source code before it arrives in the browser.
- Server configuration: The server may be removing or adding some extra lines of code.
What is the Browser Cache
Sometimes the browser will use an old version of the code instead (cache memory). This is called: Browser Cache . Caching can be a common source of confusion for junior developers, leading to changes not appearing on the website as expected.
Cache errors: You need to ensure the code you wrote is the same code rendered to your website.
Make sure to disable browser cache in the developer tools, also, get used to holding the shift key when refreshing a website during development.
How to inspect the HTML source code:
In windows, open the source code by pressing the Ctrl + U keys simultaneously. In mac, open the source code by simultaneously pressing the ⌥ Option + ⌘ Command + U keys.
2) Developer Tools Inspector
Every major browser has Developer Tools, the first tab in the developer tools is called the «inspector», and it contains -almost- everything you need to fix your bugs.
The Dev Tools Inspector shows a live version of your code instead of your original source code. This «live version» is called «The DOM». It’s what the browser was able to interpret from your code. These are some cases that make the inspector great:
If your website is not looking how you intended: Use your mouse right-click menu, and look for the «inspect» option. It will show the HTML elements that the browser created around that area. If you have written incorrect HTML code, the browser will attempt to fix it to make it display correctly, but this may only sometimes result in the desired layout. When you use the developer tools inspector, you will see the HTML code that the browser interprets, which may be different from the original source code if the browser has made any corrections.
Note: There are other -more advanced- examples where the Inspector HTML won’t match your source code; you can open these details to read more about them
Minification: Sometimes, websites compress and optimize the code for faster loading times. The HTML inspector will show the minified code, which may be difficult to read. Browser extensions: Ad blockers or script blockers modify the code shown in the HTML inspector. Server-side rendering: the HTML inspector will show the code rendered on the server rather than the source code.
3) Debugging HTML inside your Coding Editor (IDE)
The last crucial debugging tool for HTML is your coding IDE (editor). Most of the IDE’s offer the following features: Syntax highlighting: Colors help visually distinguish different parts of the HTML code, such as tags, attributes, and values, making it easier to spot errors. Linting: Some editors have built-in linters that can check your HTML code for errors and potential issues and highlight them in the editor. Validation: Some editors can validate your HTML code against the W3C standards and display error messages if there are any issues.
HTML most common errors on how to debug them
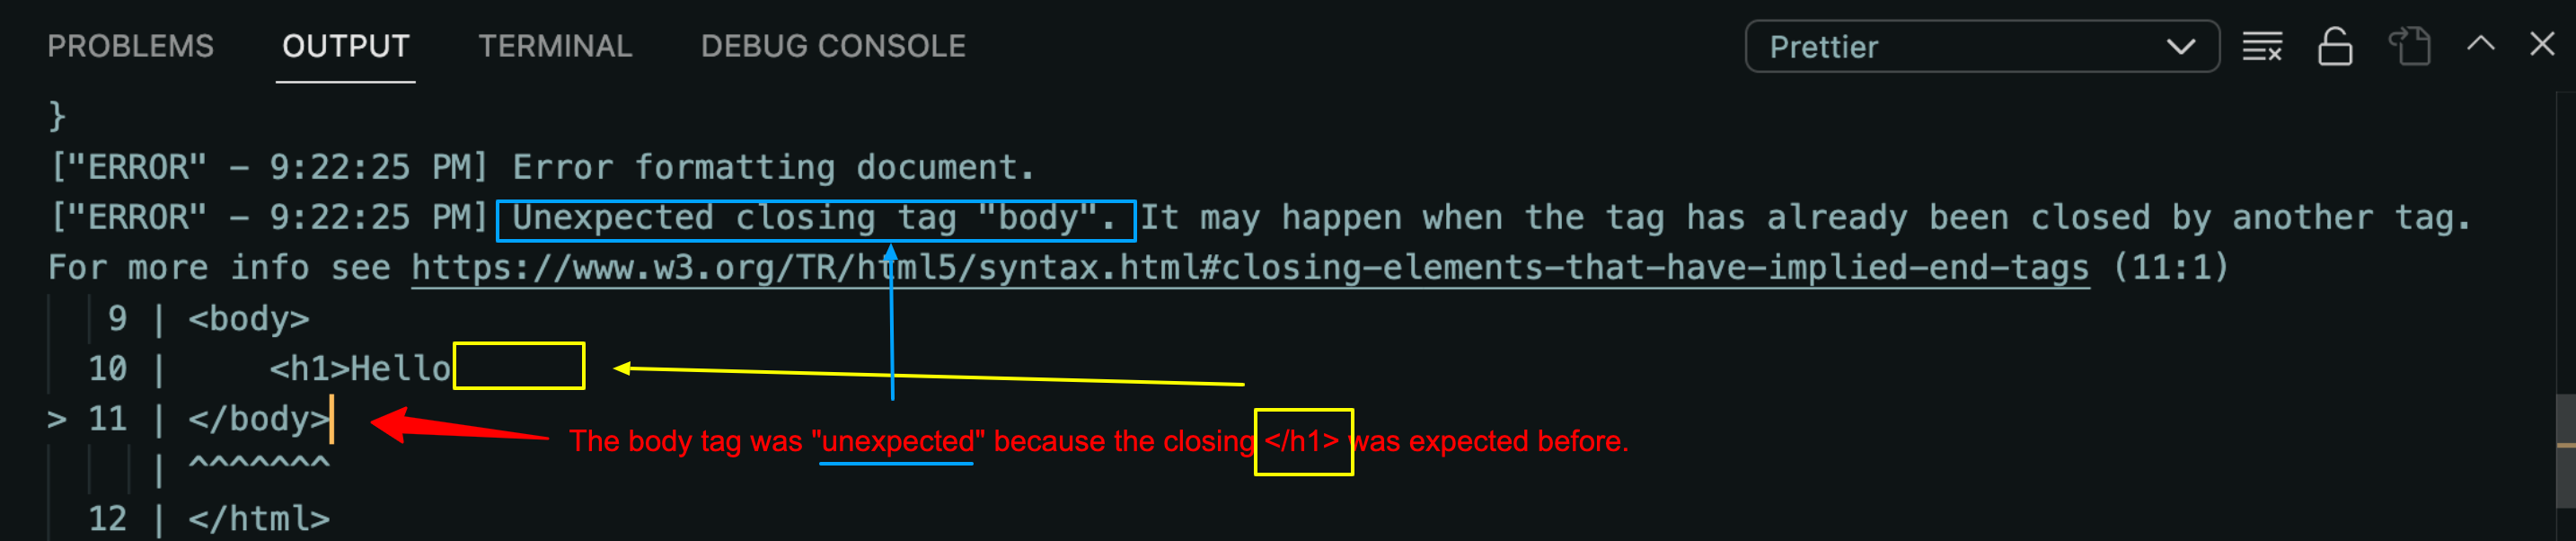
Unclosed tags
If a tag is not closed correctly. For example, if you forget to close a
tag: The code editor might highlight the entire block of code that follows the unclosed tag in red. You can also see the error in the terminal if you use plugins like prettier. If you click on an opening tag, the editor will also highlight the closing tag.
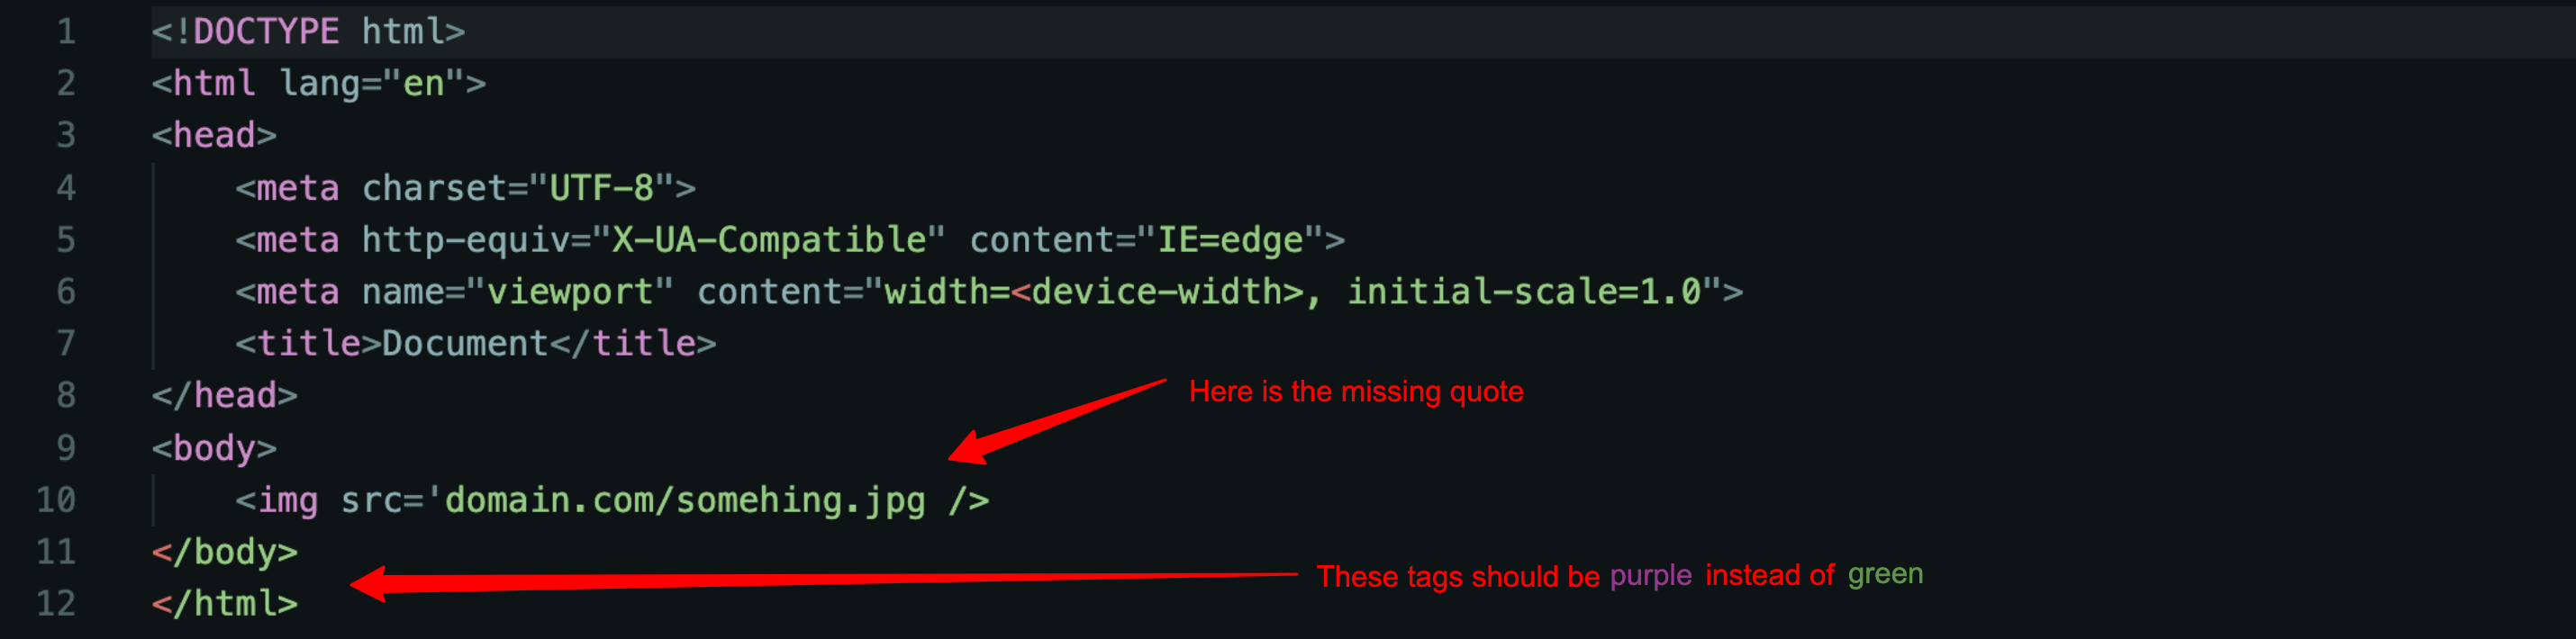
Missing quotes

HTML tags have attributes, for example, the tag has src attribute: . Unfortunately, sometimes we make mistakes when opening or closing those tags.
Two find those errors: The best tool is the syntax highlighter. It will show weird coloring; look at this image for a better understanding.
Bad or tag url
This is funny because everyone makes this mistake, I did, you did it or will do it, everyone else did it or will do it.
When linking your HTML to a separate CSS Stylesheet or Javascript Script, you will type the wrong URL, and your stylesheet won’t load.
How do you know your link tag is wrong? The Dev Tools Inspector console will show a 404 error like this (look at the image below):
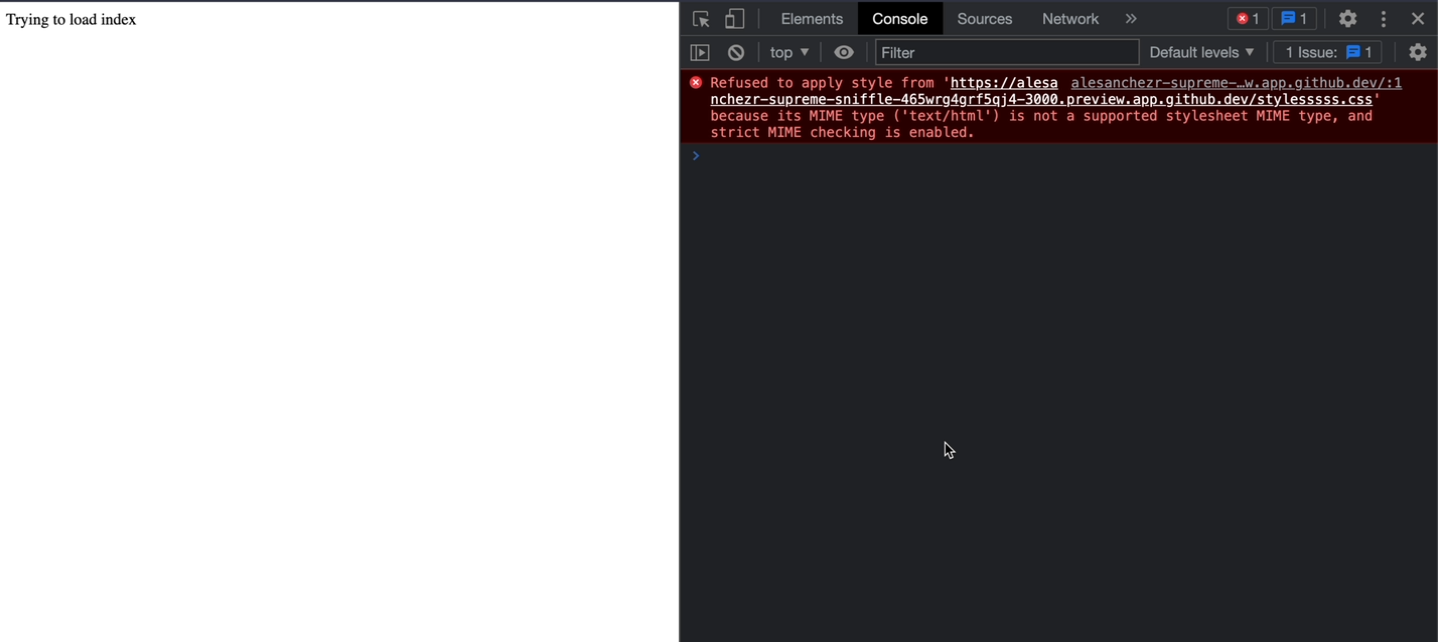
Note: It shows the URL it used to retrieve your stylesheet; check that the URL is OK.
How to Debug your HTML and solve errors?
The most common problem for web developers while developing a web page is getting random errors like some functions not working, interface issues or the lack of cross-browser compatibility . After hours of coding, getting these errors can be frustrating. So developers must debug HTML and properly resolve the errors to focus on web development.
This guide covers how to debug your HTML and a quick way to find & fix errors.
Introduction to HTML
HTML is the core language of web development and is the most popular. It is used by 97.4% of all websites available on the internet. Today, billions of people are actively visiting websites and making purchases along with a user-friendly customer experience. So it becomes essential for developers to keep the website user-friendly, adhere to responsive design , and be error-free.
HTML has kept evolving over the years and added new features and elements, including better structure, in-built compatibility, storage capability, and many more features that make the HTML-based website more powerful and preferred.
Why is Debugging HTML important?
Whenever HTML comes with new features and elements, developers also need to update their knowledge. Now, it is very common to get errors while writing the HTML codes for a web page. It may get unexpected errors like functions not working, interface issues, or not supporting cross-browser compatibility . Debugging plays an important role for developers to prevent all these errors from the HTML code.
By debugging the HTML codes, developers can identify the errors and resolve them to build an HTML website error-free according to World Wide Web Consortium (W3C) formal guidelines and structure. That’s why developers always prefer to debug their HTML codes to save their efforts & eliminate bugs/errors before they may cause any significant issues.
Some Common HTML Errors
Syntax errors
One of the most common errors developers face in HTML is syntax errors. A developer can make mistakes while writing hundreds of lines of HTML codes that can cause issues like functions not working, programs not working, or showing different results. Usually, these are common syntax errors because of small typos or closed tags left by the developer. So it’s important to check the HTML codes in a validation tool to find such bugs or errors and resolve them faster.
Outlining elements
Outlining elements is a complex & time-consuming process for developers that sometimes cause errors in HTML codes. Developers must resolve the issue to make the website interface mobile-friendly and interactive. Instead of writing CSS, many Chrome extensions are available to outline the elements that save developers both time & effort.
Turning off styles
For developers, it’s difficult to find a particular element style error by CSS. These errors are not easily recognized among hundreds of lines of HTML codes and can cause an issue later. So it’s essential to identify whether a CSS is applied on the element or is overridden by the default CSS.
In such a case, developers can use the in-built browser developer console to showcase the properties of CSS applied on each selected element. It helps developers to find whether CSS is applied on the element or overridden with another.
Display type
Every unique element in a web page has its display type, whether flex, block, inline-block, or many more. For developers, it’s hard to identify any element display type until their HTML codes follow the W3C guidelines.
To prevent errors and identify each display type, developers should write HTML codes according to formal W3C guidelines & standards.
Cross-browser Compatibility issues
Device-browser fragmentation is a hard-hitting issue in the testing ecosystem!
In today’s world, where billions of people are using smartphones and tablets, the demand for mobile-friendly websites is increasing. Sometimes HTML websites can face cross-browser compatibility issues where a website does not perform similarly on each device and this is an essential error that needs to be resolved.
Making your HTML5 code cross-browser compatible is also key to overcoming browser inconsistencies and ensuring a seamless experience across the different versions of various browsers.
Whether you’re testing HTML code in browser or finding HTML elements , BrowserStack is a one-stop testing platform for debugging and compatibility testing on 3000+ real devices and browsers. Let’s follow it up with the steps for debugging and more.
Debugging HTML Errors with BrowserStack Live
With the help of BrowserStack Live , testers can test their website functionalities in different conditions & browsers (like Chrome, Safari, Firefox, and Microsoft Edge) to debug HTML code, detect bugs and get detailed bug/error reports.
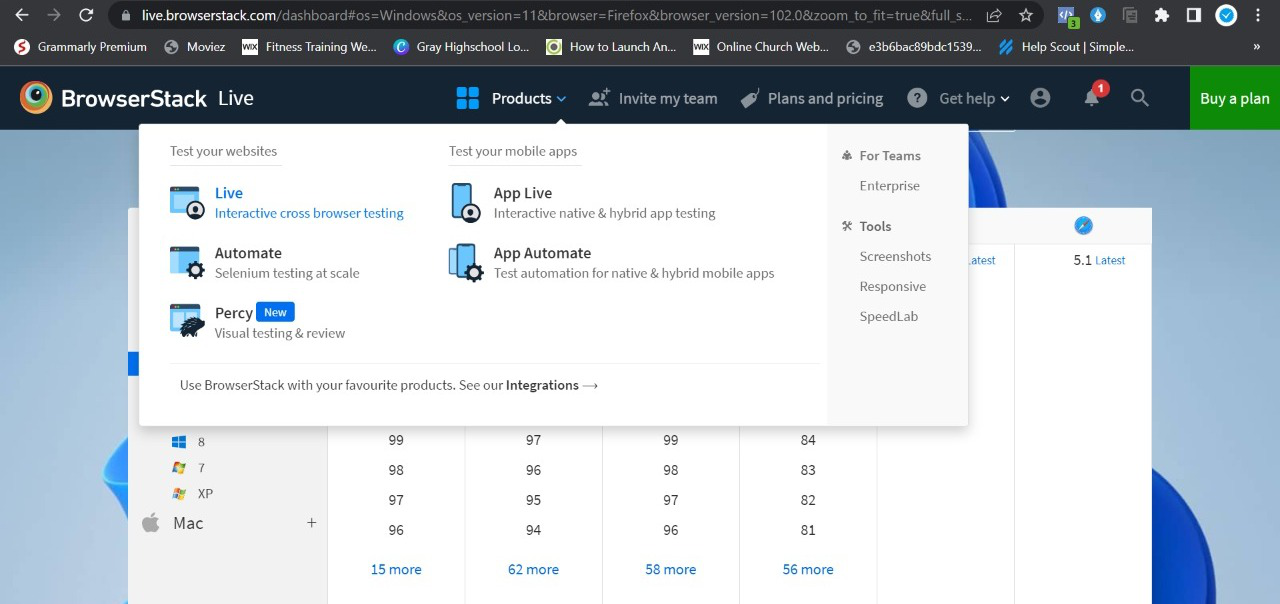
You can find bugs/errors on your website in just 4 simple steps
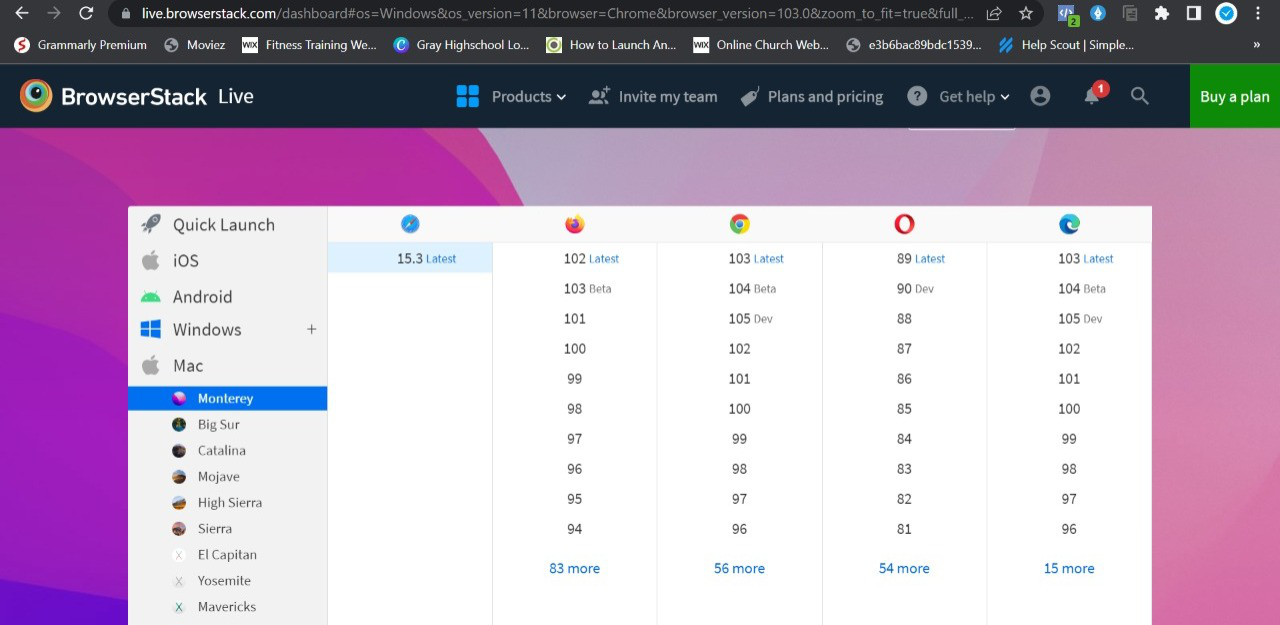
Step 1- Sign in to your BrowserStack account and go to Products – Live.
Step 2 – Select the OS & Browser from the list of available operating systems and browsers
Step 3 – Insert your website URL and start testing its functions.
Step 4 – Get your detailed test report
By following these step-by-step processes, testers can easily identify – how to fix HTML errors on any website.
There are a lot more testing and debugging covered within the BrowserStack infrastructure, including
- Geolocation Testing : It’s mainly used to understand the website performance for different geographical locations as per your business requirements in different regions.
- Detailed bug reporting : While conducting cross-browser compatibility testing, get a detailed report of errors/bugs found on the website.
- Responsive testing : It’s used to identify the website screen resolution support on different devices.
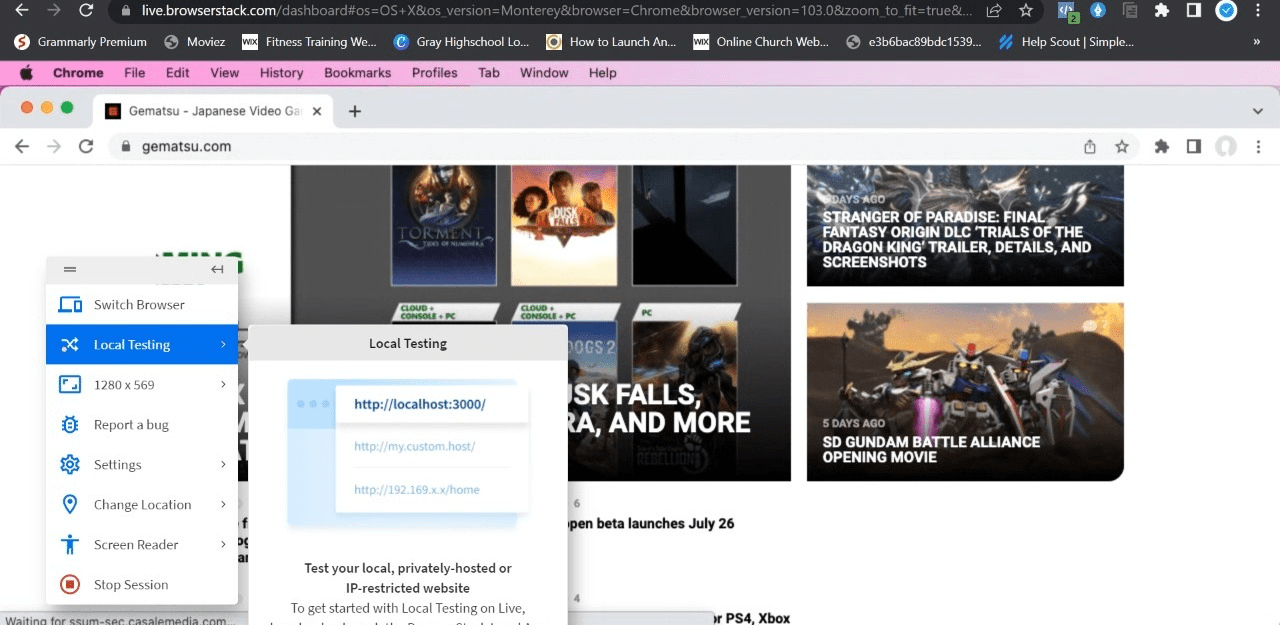
- Local testing : Local testing is a type of testing where testers test the website as an end user’s environment.
- Network throttling : This type of testing identify the website performance on different network bandwidths
To sum up, QA testers and developers are advised to debug their HTML to identify and fix HTML errors. However, do note that you can get faster results without compromising on the accuracy and solve any HTML errors before users do by testing software in real user conditions .