- Функция stdev() в Python
- Начало работы с функцией
- Стандартное отклонение с модулем NumPy
- Стандартное отклонение с модулем Pandas
- Заключение
- Как построить нормальное распределение в Python (с примерами)
- Пример 1: построение одного нормального распределения
- Пример 2: построение нескольких нормальных распределений
- Calculate Standard Deviation in Python
- What is standard deviation?
- Manually calculate standard deviation
- How to calculate standard deviation in Python?
- Standard deviation of a numpy array
- Standard deviation of a pandas series
- Author
Функция stdev() в Python
Сегодня мы представим стандартное отклонение с помощью метода stdev() в Python. Стандартное отклонение – это статистическая единица, которая представляет собой вариацию данных, то есть отображает отклонение значений данных от центрального значения (среднего значения данных).
Обычно стандартное отклонение рассчитывается по следующей формуле:
Стандартное отклонение = (Дисперсия) ^ 1/2
Теперь давайте начнем с реализации и расчета стандартного отклонения с использованием встроенной функции в Python.
Начало работы с функцией
Модуль содержит различные встроенные функции для выполнения анализа данных и других статистических функций. Функция statistics.stdev() используется для вычисления стандартного отклонения значений данных, переданных функции в качестве аргумента.
import statistics data = range(1,10) res_std = statistics.stdev(data) print(res_std)
В приведенном выше примере мы создали данные чисел от 1 до 10 с помощью функции range(). Далее мы применяем функцию stdev() для оценки стандартного отклонения значений данных.
Стандартное отклонение с модулем NumPy
Модуль NumPy преобразует элементы данных в форму массива для выполнения числовых манипуляций с ними.
Кроме того, функцию numpy.std() можно использовать для вычисления стандартного отклонения всех значений данных, присутствующих в массиве NumPy.
Нам нужно импортировать модуль NumPy в среду Python, чтобы получить доступ к его встроенным функциям, используя приведенный ниже код:
import numpy as np import pandas as pd data = np.arange(1,30) res_std = np.std(data) print(res_std)
В приведенном выше примере мы сгенерировали массив элементов от 1 до 30 с помощью функции numpy.arange(). После этого мы передаем массив в функцию numpy.std() для вычисления стандартного отклонения элементов массива.
Стандартное отклонение с модулем Pandas
Модуль Pandas преобразует значения данных в DataFrame и помогает нам анализировать огромные наборы данных и работать с ними. Функция pandas.DataFrame.std() используется для вычисления стандартного отклонения значений столбца данных определенного DataFrame.
import numpy as np import pandas as pd data = np.arange(1,10) df = pd.DataFrame(data) res_std = df.std() print(res_std)
В приведенном выше примере мы преобразовали массив NumPy в DataFrame и применили функцию DataFrame.std(), чтобы получить стандартное отклонение значений данных.
import pandas as pd import seaborn as sns import matplotlib.pyplot as plt data = pd.read_csv("C:/mtcars.csv") res_std = data['qsec'].std() print(res_std) В приведенном выше примере мы использовали набор данных и рассчитали стандартное отклонение столбца данных qsec с помощью функции DataFrame.std().

Заключение
Таким образом, в этой статье мы поняли, как работает функция Python stdev() вместе с модулем NumPy и Pandas.
Как построить нормальное распределение в Python (с примерами)

Чтобы построить нормальное распределение в Python, вы можете использовать следующий синтаксис:
#x-axis ranges from -3 and 3 with .001 steps x = np.arange (-3, 3, 0.001) #plot normal distribution with mean 0 and standard deviation 1 plt.plot (x, norm. pdf (x, 0, 1)) Массив x определяет диапазон для оси x, а plt.plot() создает кривую для нормального распределения с указанным средним значением и стандартным отклонением.
В следующих примерах показано, как использовать эти функции на практике.
Пример 1: построение одного нормального распределения
Следующий код показывает, как построить одну кривую нормального распределения со средним значением 0 и стандартным отклонением 1:
import numpy as np import matplotlib.pyplot as plt from scipy. stats import norm #x-axis ranges from -3 and 3 with .001 steps x = np.arange (-3, 3, 0.001) #plot normal distribution with mean 0 and standard deviation 1 plt.plot (x, norm. pdf (x, 0, 1)) 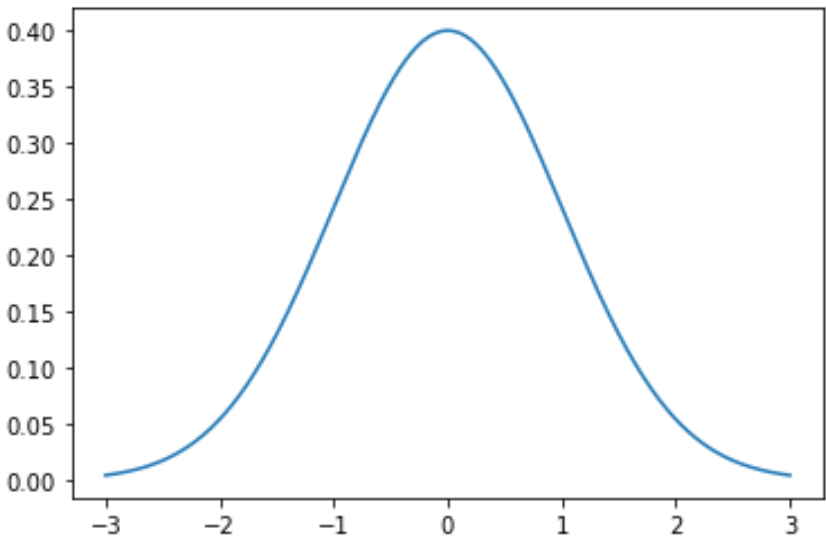
Вы также можете изменить цвет и ширину линии на графике:
plt.plot (x, norm. pdf (x, 0, 1), color='red', linewidth= 3 ) 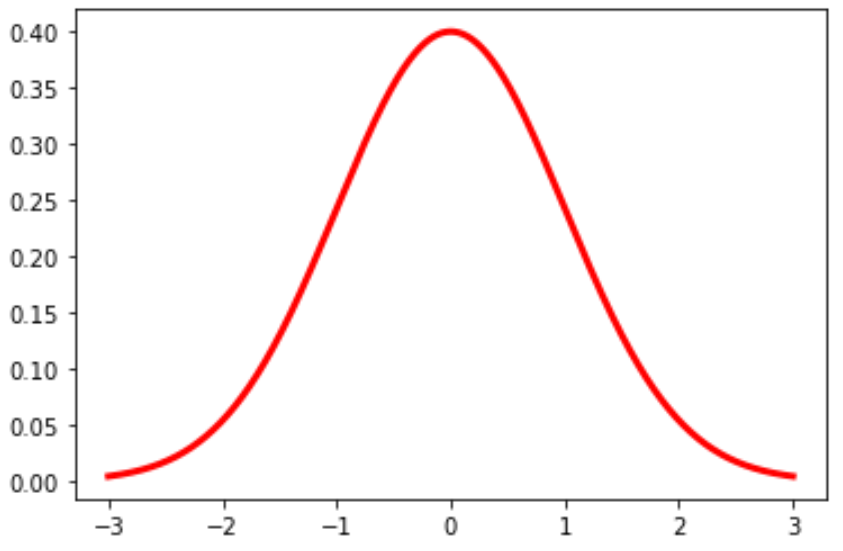
Пример 2: построение нескольких нормальных распределений
Следующий код показывает, как построить несколько кривых нормального распределения с разными средними значениями и стандартными отклонениями:
import numpy as np import matplotlib.pyplot as plt from scipy. stats import norm #x-axis ranges from -5 and 5 with .001 steps x = np.arange (-5, 5, 0.001) #define multiple normal distributions plt.plot (x, norm. pdf (x, 0, 1), label='μ: 0, σ: 1') plt.plot (x, norm. pdf (x, 0, 1.5), label='μ:0, σ: 1.5') plt.plot (x, norm. pdf (x, 0, 2), label='μ:0, σ: 2') #add legend to plot plt.legend() 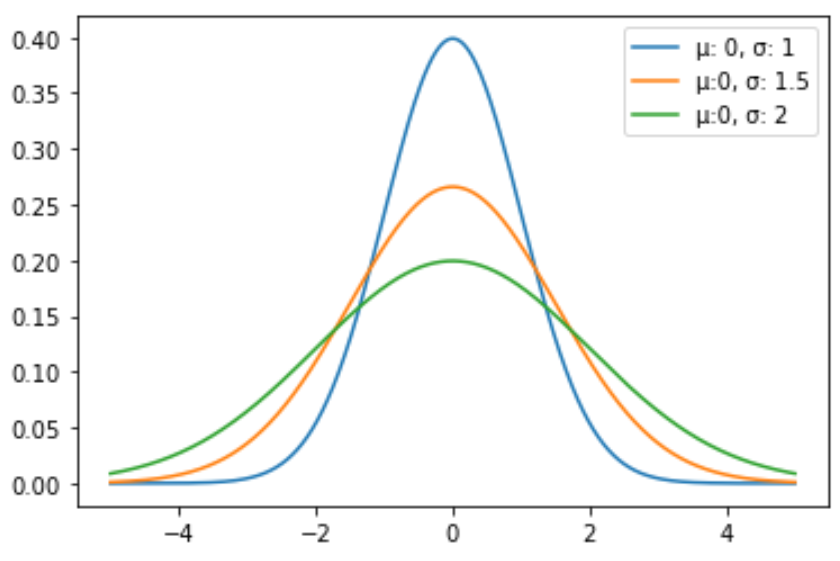
Не стесняйтесь изменять цвета линий и добавлять заголовок и метки осей, чтобы сделать диаграмму завершенной:
import numpy as np import matplotlib.pyplot as plt from scipy. stats import norm #x-axis ranges from -5 and 5 with .001 steps x = np.arange (-5, 5, 0.001) #define multiple normal distributions plt.plot (x, norm. pdf (x, 0, 1), label='μ: 0, σ: 1', color='gold') plt.plot (x, norm. pdf (x, 0, 1.5), label='μ:0, σ: 1.5', color='red') plt.plot (x, norm. pdf (x, 0, 2), label='μ:0, σ: 2', color='pink') #add legend to plot plt.legend(title='Parameters') #add axes labels and a title plt.ylabel('Density') plt.xlabel('x') plt.title('Normal Distributions', fontsize= 14 ) 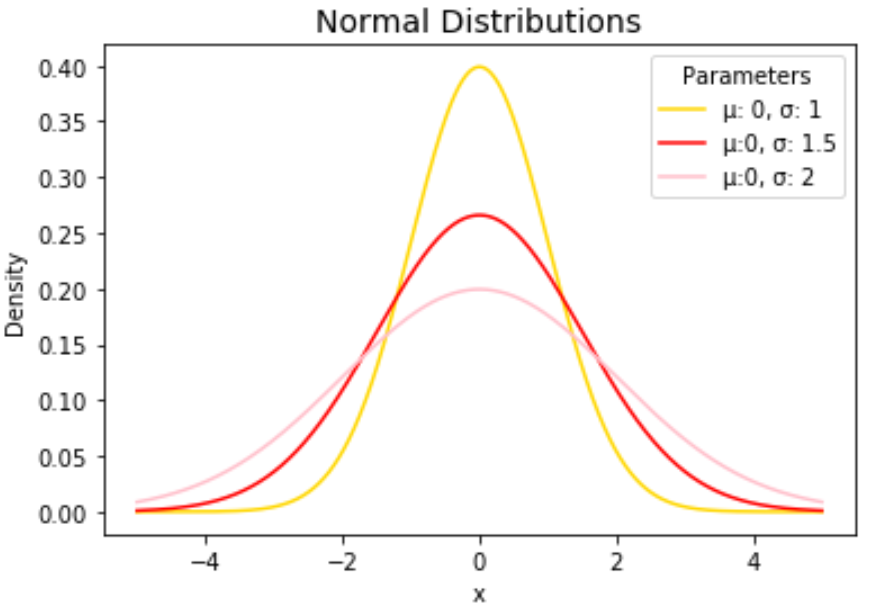
Подробное описание функции plt.plot() см. в документации по matplotlib.
Calculate Standard Deviation in Python
Standard deviation is an important metric that is used to measure the spread in the data. It has useful applications in describing the data, statistical testing, etc. There are a number of ways in which you can calculate the standard deviation of a list of values in Python which is covered in this tutorial with examples.

In this tutorial, we will look at –
📚 Discover Online Data Science Courses & Programs (Enroll for Free)
Introductory ⭐
Intermediate ⭐⭐⭐
🔎 Find Data Science Programs 👨💻 111,889 already enrolled
Disclaimer: Data Science Parichay is reader supported. When you purchase a course through a link on this site, we may earn a small commission at no additional cost to you. Earned commissions help support this website and its team of writers.
- What is standard deviation?
- Manually calculate standard deviation
- How to calculate standard deviation of a list in Python?
- Standard deviation of a numpy array
- Standard deviation of a pandas series
What is standard deviation?
Standard deviation is a measure of spread in the data. This means that if the standard deviation is higher, the data is more spread out and if it’s lower, the data is more centered. It is calculated by taking the square root of the variance. The following is the formula of standard deviation.

Note that the above is the formula for the population standard deviation. For sample standard deviation, we use the sample mean in place of the population mean and (sample size – 1) in place of the population size.
Both variance and standard deviation are measures of spread but the standard deviation is more commonly used. This is because the standard deviation is in the same units as the data.
Manually calculate standard deviation
Before we proceed to the computing standard deviation in Python, let’s calculate it manually to get an idea of what’s happening. For example, let’s calculate the standard deviation of the list of values [7, 2, 4, 3, 9, 12, 10, 1].
To calculate the standard deviation, let’s first calculate the mean of the list of values.

The mean comes out to be six (μ = 6).
Now, to calculate the standard deviation, using the above formula, we sum the squares of the difference between the value and the mean and then divide this sum by n to get the variance.

The variance comes out to be 14.5
The standard deviation can then be calculated by taking the square root of the variance.
![]()
How to calculate standard deviation in Python?
There are a number of ways to compute standard deviation in Python. You can write your own function to calculate the standard deviation or use off-the-shelf methods from numpy or pandas.
Let’s write a vanilla implementation of calculating std dev from scratch in Python without using any external libraries.
def get_std_dev(ls): n = len(ls) mean = sum(ls) / n var = sum((x - mean)**2 for x in ls) / n std_dev = var ** 0.5 return std_dev # create a list of data points ls = [7, 2, 4, 3, 9, 12, 10, 2] get_std_dev(ls)
Here, we created a function to return the standard deviation of a list of values. Notice that we used the Python built-in sum() function to compute the sum for mean and variance. This function computes the sum of the sequence passed.
The above method is not the only way to get the standard deviation of a list of values. You can store the values as a numpy array or a pandas series and then use the simple one-line implementations for calculating standard deviations from these libraries.
Standard deviation of a numpy array
You can store the list of values as a numpy array and then use the numpy ndarray std() function to directly calculate the standard deviation. Here’s an example –
import numpy as np # list of data points ls = [7, 2, 4, 3, 9, 12, 10, 2] # create numpy array of list values ar = np.array(ls) # get the standard deviation print(ar.std())
You can see that we get the same result as above.
Standard deviation of a pandas series
You can also store the list of values as pandas series and then compute its standard deviation using the pandas series std() function.
This method is very similar to the numpy array method. In fact, under the hood, a number of pandas methods are wrappers on numpy methods.
Let’s compute the standard deviation of the same list of values using pandas this time.
import pandas as pd # list of data points ls = [7, 2, 4, 3, 9, 12, 10, 2] # create pandas series of list values col = pd.Series(ls) # get the standard deviation print(col.std())
You can see that the result is higher compared to the previous two examples. This is because pandas calculates the sample standard deviation by default (normalizing by N – 1). To get the population standard deviation, pass ddof = 0 to the std() function.
# get the standard deviation print(col.std(ddof=0))
Now we get the same standard deviation as the above two examples.
Note that pandas is generally used for working with two-dimensional data and offers a range of methods to manipulate, aggregate, and analyze data. For example, you can calculate the standard deviation of each column in a pandas dataframe.
With this, we come to the end of this tutorial. The code examples and results presented in this tutorial have been implemented in a Jupyter Notebook with a python (version 3.8.3) kernel having numpy version 1.18.5 and pandas version 1.0.5
Subscribe to our newsletter for more informative guides and tutorials.
We do not spam and you can opt out any time.
Author
Piyush is a data professional passionate about using data to understand things better and make informed decisions. He has experience working as a Data Scientist in the consulting domain and holds an engineering degree from IIT Roorkee. His hobbies include watching cricket, reading, and working on side projects. View all posts
Data Science Parichay is an educational website offering easy-to-understand tutorials on topics in Data Science with the help of clear and fun examples.