Tutorial 2: Adding formatting to the XLSX File
In the previous section we created a simple spreadsheet using Python and the XlsxWriter module.
This converted the required data into an Excel file but it looked a little bare. In order to make the information clearer we would like to add some simple formatting, like this:
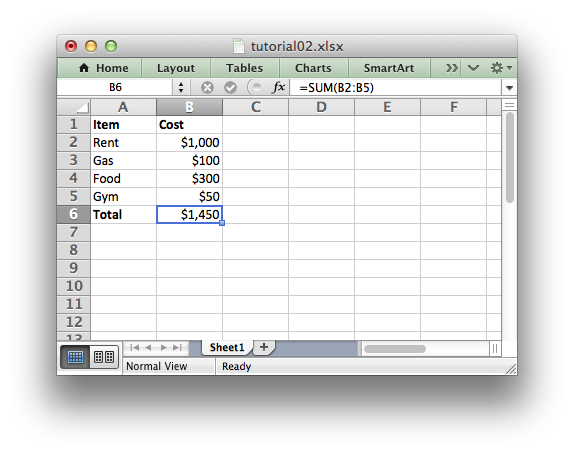
The differences here are that we have added Item and Cost column headers in a bold font, we have formatted the currency in the second column and we have made the Total string bold.
To do this we can extend our program as follows:
(The significant changes are shown with a red line.)
import xlsxwriter # Create a workbook and add a worksheet. workbook = xlsxwriter.Workbook('Expenses02.xlsx') worksheet = workbook.add_worksheet() # Add a bold format to use to highlight cells. bold = workbook.add_format('bold': True>) # Add a number format for cells with money. money = workbook.add_format('num_format': '$#,##0'>) # Write some data headers. worksheet.write('A1', 'Item', bold) worksheet.write('B1', 'Cost', bold) # Some data we want to write to the worksheet. expenses = ( ['Rent', 1000], ['Gas', 100], ['Food', 300], ['Gym', 50], ) # Start from the first cell below the headers. row = 1 col = 0 # Iterate over the data and write it out row by row. for item, cost in (expenses): worksheet.write(row, col, item) worksheet.write(row, col + 1, cost, money) row += 1 # Write a total using a formula. worksheet.write(row, 0, 'Total', bold) worksheet.write(row, 1, '=SUM(B2:B5)', money) workbook.close()
The main difference between this and the previous program is that we have added two Format objects that we can use to format cells in the spreadsheet.
Format objects represent all of the formatting properties that can be applied to a cell in Excel such as fonts, number formatting, colors and borders. This is explained in more detail in The Format Class section.
For now we will avoid getting into the details and just use a limited amount of the format functionality to add some simple formatting:
# Add a bold format to use to highlight cells. bold = workbook.add_format('bold': True>) # Add a number format for cells with money. money = workbook.add_format('num_format': '$#,##0'>)
We can then pass these formats as an optional third parameter to the worksheet. write() method to format the data in the cell:
write(row, column, token, [format])
worksheet.write(row, 0, 'Total', bold)
Which leads us to another new feature in this program. To add the headers in the first row of the worksheet we used write() like this:
worksheet.write('A1', 'Item', bold) worksheet.write('B1', 'Cost', bold)
So, instead of (row, col) we used the Excel ‘A1’ style notation. See Working with Cell Notation for more details but don’t be too concerned about it for now. It is just a little syntactic sugar to help with laying out worksheets.
In the next section we will look at handling more data types.
© Copyright 2013-2023, John McNamara.
Created using Sphinx 1.8.6.
Python openpyxl – Excel Formatting Cells
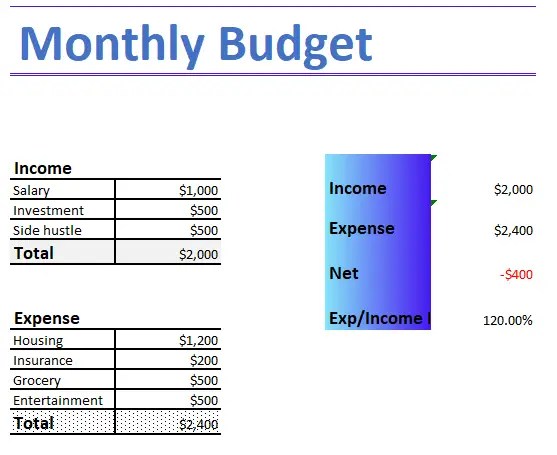
This tutorial will show you how to use the Python openpyxl library to customize Excel formatting such as cell color, alignment, borderlines, etc. We’ll continue with the previous example to make our monthly budget spreadsheet look prettier.
Library
The only library required is openpyxl, type the following in the command prompt window to install the library:
Python & Excel – Cell Formatting
Collectively, these attributes are called styles but I still prefer calling them just formats. One thing to note is that we can apply styles to only one cell at a time. So we’ll need to do a loop in order to format a range of cells.
Color – Pattern (solid) Fill
There are two types of cell color formatting: Pattern Fill and Gradient Fill.
We use Pattern Fill to make a solid color or a pattern for the cell. A Pattern Fill refers to the following formatting in Excel:
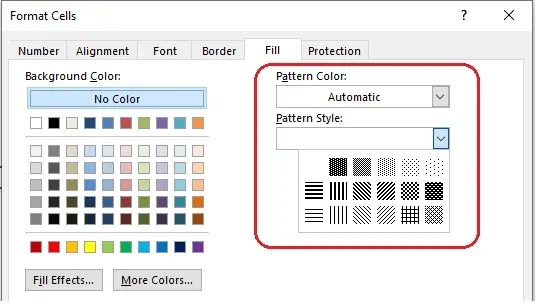
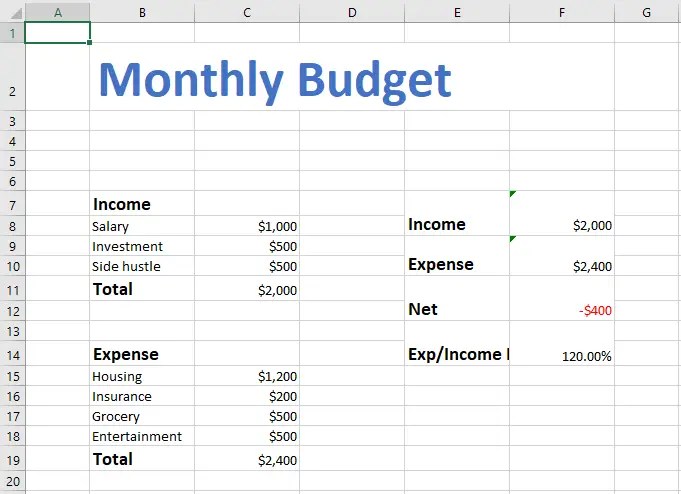
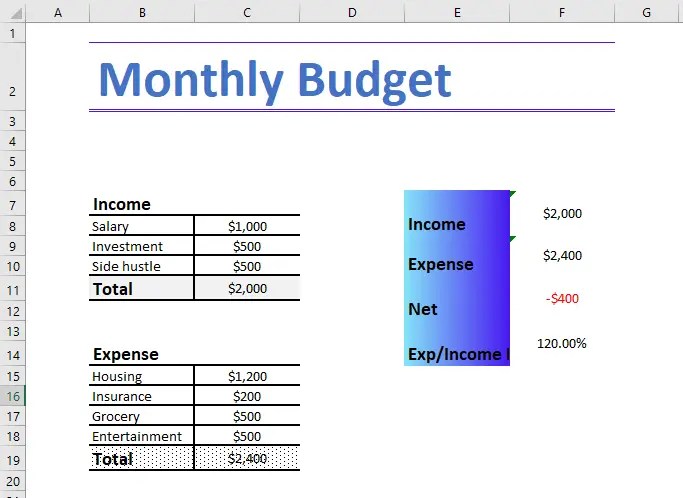
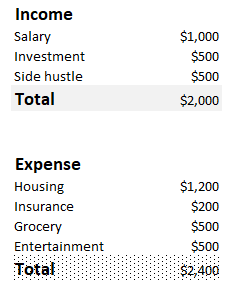
The below code changes cells B11:C11 to a light gray background and changes cells B19:C19 to a dotted background known as 6.25% Gray (found in the Pattern Style dropbox). To make the formatting easier to see, we’ll hide all gridlines in Excel by setting ws.sheet_view.showGridLines to False.
Color – Gradient Fill
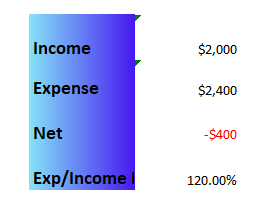
A Gradient Fill usually takes two colors and interpolates colors between them and fills the cell background. The following code takes a cyan color (’85E4F7′) and a light blue color (‘4617F1’) for the gradient fill. You can change the two RGB hex code inside the stop argument to any color to create your own gradient fill.
Borderlines
Borderlines refer to the four sides of a cell. With openpyxl, we can control the style (solid vs dash, etc), thickness, color, and position of the borderlines. We need two objects to model a cell’s borderline: Border and Side.
A Border can contain one or multiple Sides. Then we assign the cell.border attribute to a Border object to create the borderlines.
Text Alignment
We use the Alignment object to model text/number alignment within a cell, then assign the cell.alignment attribute to the object.
Создание информативных и красивых Excel документов. XlsxWriter и Pandas

В данном материале мы пройдемся по наиболее полезным функциям, которые нам предоставляет связка pandas и XlsxWriter для записи данных.
Для начала загружаем зависимости и создаём DataFrame:
import pandas as pd import numpy as np import matplotlib.pyplot as plt sales_df = pd.read_excel('https://github.com/chris1610/pbpython/blob/master/data/sample-salesv3.xlsx?raw=true') sales_summary = sales_df.groupby(['name'])['ext price'].agg(['sum', 'mean']).reset_index() sales_summary 
Сохранение данных с использованием библиотеки XlsxWriter следует проводить одним из следующих образов:
sales_summary.to_excel('table.xlsx', engine='xlsxwriter', index=False)with pd.ExcelWriter('table.xlsx', engine='xlsxwriter') as wb: sales_summary.to_excel(wb, sheet_name='Summary', index=False) Используя первый способ данные просто сохраняются в файл table.xlsx с использованием движка XlsxWriter (требует, чтобы был установлен соответствующий пакет). В целом, когда нам не требуется применять форматирование, параметр engine можно и опустить.
Во втором случае, помимо того, что мы имеем возможность сохранить несколько DataFrame на одном или нескольких листах, так же возможно добавить ячейкам форматирование, вставить графики и специализированные таблицы.
Автофильтрация
Наиболее простой в реализации функцией форматирования будет добавления автофильтров. Для этого на соответствующем листе следует вызвать метод autofilter и указать диапазон применения фильтрования:
with pd.ExcelWriter('table.xlsx', engine='xlsxwriter') as wb: sales_summary.to_excel(wb, sheet_name='Sheet1', index=False) sheet = wb.sheets['Sheet1'] sheet.autofilter('A1:C'+str(sales_summary.shape[0])) Возможно применение и индексной нотации:
sheet.autofilter(0, 0, sales_summary.shape[0], 2)(Более подробно о autofilter по ссылке )
По документации требуется указывать полностью диапазон ячеек, использующихся в автофильтре, но в реальности excel корректно применяет фильтр даже когда указан только диапазон колонок, что несколько упрощает работу. Например, как в следующем случае:
Настройка размеров ячеек
Изначально XlsxWriter предоставляет нам инструменты для установки высоты и ширины как для целых строк и столбцов, так и для их диапазонов, с некоторой оговоркой.
Чтобы установить высоту одной строки следует использовать метод:
где 0 – индекс строки, 20 – высота строки.
Для установки высоты нескольких строк потребуется провести итерацию по всем нужным строкам, или же можно установить значение высоты строки по умолчанию для всего документа:
Для установки ширины столбца есть такой метод:
sheet.set_column(0, 0, 30) # Установить ширину одного столбца A в 30 sheet.set_column(0, 2, 30) # Установить ширину столбцов A, B, C в 30 sheet.set_column('A:C', 30) # Установить ширину столбцов A, B, C в 30 Важно заметить, что хоть официальная документация и утверждает, что при настройке ширины столбцов не должно быть пересекающихся диапазонов, однако следующий код прекрасно работает:
with pd.ExcelWriter('table.xlsx', engine='xlsxwriter') as wb: sales_summary.to_excel(wb, sheet_name='Sheet1', index=False) sheet = wb.sheets['Sheet1'] sheet.autofilter(0, 0, 0, 2) sheet.set_column('A:C', 30) sheet.set_column('B:B', 8) 
Установка значения по умолчанию для ширины столбцов не предусмотрена автором библиотеки. Так же библиотека не предусматривает инструмента для определения автоматической ширины или высоты ячеек, приходится мириться с этим неудобством и искать похожие по функциям обходные решения на форумах (например, тут).
Форматирование текста
Форматирование текста, такое как изменение размера, шрифта, цвета и т.д. так же делается с использованием уже известных нам функций: set_column и set_row.
with pd.ExcelWriter('table.xlsx', engine='xlsxwriter') as wb: sales_summary.to_excel(wb, sheet_name='Sheet1', index=False) sheet = wb.sheets['Sheet1'] cell_format = wb.book.add_format() cell_format.set_bold() cell_format.set_font_color('red') sheet.set_row(1, 40, cell_format) # Установка стиля для строки 2 и высоты 40 cell_format = wb.book.add_format() cell_format.set_bold() cell_format.set_font_color('green') sheet.set_column(2, 2, 20, cell_format) # Установка стиля для столбца C и ширины 20 cell_format = wb.book.add_format() cell_format.set_bold() cell_format.set_font_color('blue') sheet.set_column('A:B', 20, cell_format) # Установка стиля для столбцов A и B и ширины 20 В результате получаем следующий файл:

Из таблицы виден важный факт:
стиль ячеек не может быть перезаписан. На строку с заголовками pandas уже применил форматирование, таким образов мы на него уже воздействовать никак не можем. Аналогично со строкой 2, ячейки которой по идее должны были окраситься в синий и зеленый цвета, однако этого не произошло.
Если есть сильное желание придать свой собственный формат строке с заголовками таблицы, то можно сделать так:
with pd.ExcelWriter('table.xlsx', engine='xlsxwriter') as wb: sales_summary.to_excel(wb, sheet_name='Sheet1', index=False, header=False, startrow=1) sheet = wb.sheets['Sheet1'] cell_format = wb.book.add_format() cell_format.set_font_color('purple') cell_format.set_bg_color('#AAAAAA') cell_format.set_font_size(18) sheet.write_row(0, 0, sales_summary.columns, cell_format) # сразу пишем целую строку данных # аналогично #for col, name in enumerate(sales_summary.columns): # sheet.write(0, col, name, cell_format) 
Добавление графиков
Помимо чистых цифр, бывает полезно добавить в таблицу некоторую сопровождающую информацию, например графики. Они могут быть сгенерированы средствами Excel или же как обыкновенное сгенерированное изображение.
Добавление сгенерированного изображения максимально просто и понятно.
- Создаём изображение
- Сохраняем его как файл
- Указываем полный или относительный путь к файлу изображения, ячейку, в которую хотим поместить изображение и дополнительные опции, если нужно (например отступ от края ячейки, масштабирование ширины, высоты изображения и т.д.. Подробнее о списке опций по ссылке
Пример добавления изображения в документ:
with pd.ExcelWriter('table.xlsx', engine='xlsxwriter') as wb: sales_summary.to_excel(wb, sheet_name='Sheet1', index=False) sheet = wb.sheets['Sheet1'] sheet.set_column('A:C', 12) plt.pie(sales_summary['sum'], labels=sales_summary['name'], radius=1.4) plt.savefig('pie.jpeg', dpi=200, bbox_inches='tight') sheet.insert_image('E2', 'pie.jpeg') 
С другой стороны, для добавления графиков используется непосредственно средствами библиотеки XlsxWriter метод add_chart объекта типа worksheet, в параметрах которого можно указать тип графика (pie в данном случае). После этого нужно заполнить списки категорий и значений через метод add_series. Данный метод принимает ссылки в буквенной и в численной нотации.
Перед добавлением графика на лист, можно дополнительно отформатировать внешний вид легенды, добавить ещё данных на ту же область, добавить названия осей и т.д. Под конец необходимо добавить график на лист вызовом метода insert_chart. Более подробно о работе с графиками в XlsxWriter можно почитать по ссылке
with pd.ExcelWriter('table.xlsx', engine='xlsxwriter') as wb: sales_summary.to_excel(wb, sheet_name='Sheet1', index=False) sheet = wb.sheets['Sheet1'] sheet.set_column('A:C', 12) chart = wb.book.add_chart() chart.add_series(< 'categories': '=Sheet1!$A$2:$A$'+str(sales_summary.shape[0]+1), 'values': '=Sheet1!$B$2:$B$'+str(sales_summary.shape[0]+1), >) # Аналогично #chart.add_series(< # 'categories': ['Sheet1', 1, 0, sales_summary.shape[0], 0], # 'values': ['Sheet1', 1, 1, sales_summary.shape[0], 1], #>) chart.set_legend() sheet.insert_chart('E2', chart, < 'x_scale': 2, 'y_scale': 2 >) #Аналогично #sheet.insert_chart(1, 4, chart, < # 'x_scale': 1.5, 'y_scale': 2 #>) 
Мы рассмотрели некоторые возможности, которые предоставляет нам связка библиотек Pandas и XlsxWriter. Их очень легко и удобно встраивать в собственные проекты. Использование средств, описанных в данной статье, не исчерпывают все возможности этих библиотек, но даже с этим скромным инструментарием в кармане, вы можете сделать ваши выгрузки намного более информативными и приятными глазу.