Пишем графическую программу на Python с tkinter
В работе со студентами и учениками я заметила, что при изучении какого-либо языка программирования большой интерес вызывает работа с графикой. Даже те студенты, которые скучали на заданиях про числа Фибоначчи, и уже казалось бы у них пропадал интерес к изучению языка, активизировались на темах, связанных с графикой.
Поэтому предлагаю потренироваться в написании небольшой графической програмки на Python с использованием tkinter (кроссплатформенная библиотека для разработки графического интерфейса на языке Python).
Код в этой статье написан для Python 3.5.
Задание: написание программы для рисования на холсте произвольного размера кругов разных цветов.
Не сложно, возможно программа «детская», но я думаю, для яркой иллюстрации того, что может tkinter самое оно.
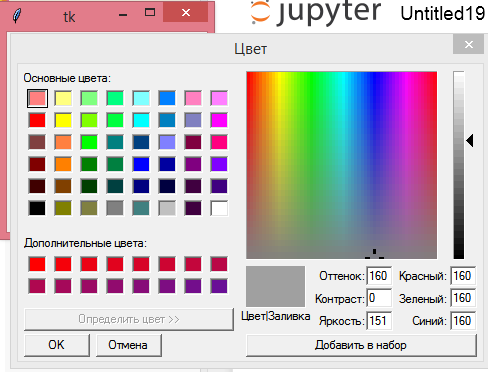
Хочу рассказать сначала о том, как указать цвет. Конечно удобным для компьютера способом. Для этого в tkinter есть специальный инструмент, который можно запустить таким образом:
from tkinter import * window = Tk() colorchooser.askcolor() - rom tkinter import * — импорт библиотеки, вернее всех ее методов, на что указывает звездочка (*);
- window = Tk() — создание окна tkinter;
- colorchooser.askcolor() — открывает окно выбора цвета и возвращает кортеж из двух значений: кортеж из трех элементов, интенсивность каждой RGB цвета, и строка. цвет в шестнадцатиричной системе.
Примечание: как сказано в коментариях ниже — звёздочка не все импортирует, надёжнее будет написать
from tkinter import colorchooser
Можно для определения цвета рисования использовать английские название цветов. Здесь хочу заметить, что не все они поддерживаются. Тут говорится, что без проблем вы можете использовать цвета «white», «black», «red», «green», «blue», «cyan», «yellow», «magenta». Но я все таки поэкспериментировала, и вы увидите дальше, что из этого вышло.
Для того, чтобы рисовать в Python необходимо создать холст. Для рисования используется система координат х и у, где точка (0, 0) находится в верхнем левом углу.
В общем хватит вступлений — начнем.
from random import * from tkinter import * size = 600 root = Tk() canvas = Canvas(root, width=size, height=size) canvas.pack() diapason = 0 - from random import * — импорт всех методов модуля random;
- from tkinter import * — это вы уже знаете;
- переменная size понадобится потом;
- root = Tk() — создаем окно;
- canvas = Canvas(root, width=size, height=size) — создаем холст, используя значение переменной size (вот она и понадобилась);
- canvas.pack() — указание расположить холст внутри окна;
- переменная diapason понадобится потом для использования в условии цикла.
colors = choice(['aqua', 'blue', 'fuchsia', 'green', 'maroon', 'orange', 'pink', 'purple', 'red','yellow', 'violet', 'indigo', 'chartreuse', 'lime', ''#f55c4b'']) Создаем список для якобы случайного выбора цвета кругов. Заметьте, что один из цветов написан в формате »#f55c4b» — код цвета в шестнадцатиричной системе.
Здесь хочу остановиться на выборе цвета. Мне хотелось добавить как можно больше вариантов выбора цвета, поэтому я воспользовалась таблицей названий цветов в английском языке. Но вскоре поняла, что многие английские названия не поддерживаются — программа переставала работать. Поэтому определение цвета в шестнадцатиричной системе будет для этих целей более подходящим вариантом.
x0 = randint(0, size) и y0 = randint(0, size) — случайный выбор координат х и у в рамках холста размером size.
d randint(0, size/5) — произвольный выбор размера круга, ограниченный size/5.
canvas.create_oval(x0, y0, x0+d, y0+d, fill=colors) — собственно говоря рисуем круги, в точках с координатами x0 и y0, размерами по вертикали и горизонтали x0+d и y0+d, заливкой цветом, который выбирается случайным образом из списка colors.
root.update() — update() — обрабатывает все задачи, стоящие в очереди. Обычно эта функция используется во время «тяжёлых» расчётов, когда необходимо чтобы приложение оставалось отзывчивым на действия пользователя.
Без этого в итоге отобразятся круги, но процесс их появления будет вам не виден. А именно это придает шарм этой програмке.
diapason += 1 — шаг цикла, счетчик.
В результате получается такая картинка:
Мне не понравилось, что справа и вверху какие-то пустые места образовываются, поэтому я немного изменила условие цикла while diapason < 2000 или 3000. Так холст получился более заполненным.
Также можно сделать цикл бесконечным:
while True: colors = choicecolors = choice(['aqua', 'blue', 'fuchsia', 'green', 'maroon', 'orange', 'pink', 'purple', 'red','yellow', 'violet', 'indigo', 'chartreuse', 'lime']) x0 = randint(0, size) y0 = randint(0, size) d = randint(0, size/5) canvas.create_oval(x0, y0, x0+d, y0+d, fill=colors ) root.update() Я думаю, можно было бы еще поиграться со скоростью рисования кругов или их движением по холсту. Можно было увеличить варианты выбора цветов. Поставить условие для остановки бесконечного цикла, например по нажатию пробела. Это все задания для будущих программ.
Студенты еще спросили, а можно ли запускать это как заставку на рабочем столе Windows? Пока не нашла как это можно было бы сделать.
Graphics Module in Python
Graphics is the most interesting topic to start with while learning any programming language, especially for kids and Graphics-based game developers. The applications of Graphics are endless in the field of programming and computer science.
Although this article covers a lot about Graphics in Python, it is also essential for students to have a thorough understanding of Computer Graphics as a separate subject. It is because each pixel and screen resolution, aspect ratios are some essential ingredients that computer graphics cater to in every system.
In this article, you will learn how the Graphic module in Python allows drawing simple objects using functions such as the GraphWin(), Point(), Circle() and many more. You will be creating a real graphic using these objects as well.
Following is the list of topics covered:
- Steps to create a graphic in Python
- Features of Graphic Window
- Creating different types of Graphic objects
- Implementing real graphic examples
Steps to create graphics
Creating graphics in Python contains a few basic and fixed steps:
- Import all libraries from the graphics Class
- Create a Window object
- Draw the objects in the created window.
- Close the window.
For example:
step 1: from graphics import * step 2: win = GraphWin() step 3: pt = Point(100, 50) #100 indicates horizontal coordinate and 50 indicates vertical coordinate pt.draw(win) step 4: win.close()Graphic window
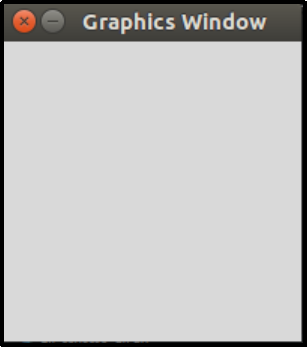
You can create a graphics within a window using the GraphWin() method which creates a new window somewhere beneath another window. To view it, you can drag it at the top. This window by default is labeled as “Graphics Window” and creates a default 200 X 200 pixels window.
A pixel (Picture Element) is nothing but a tiny square displayed on your screen, usually, there are 1000 pixels on the screen and more the number of pixels per row more is the screen resolution and better the image quality will become. It is because each pixel can store more detailed element of the image.
Default graphic window
The GraphWin() method can take three arguments:
- Title for the graphic window.
- X-coordinate (the length of the graphic window).
- Y-coordinate (the height of the graphic window).
For example:
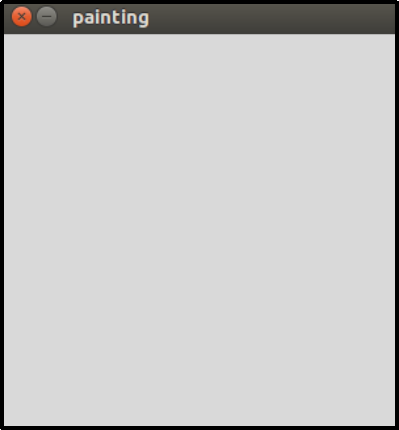
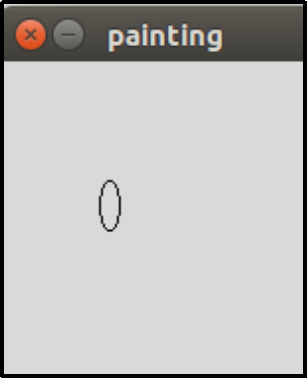
from graphics import * win = GraphWin("painting", 300, 300)Graphic window with label painting and having specific coordinates
Graphic objects
Point object
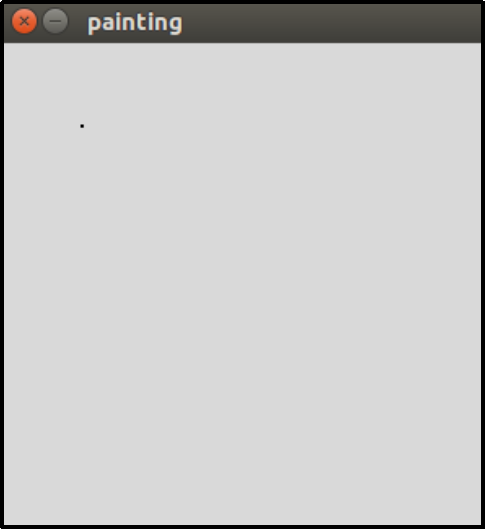
Point: To create a point object you can use the Point() method with X and Y coordinates.
pt = Point(50, 50) To display the point on the graphic window, you can use pt.draw(win).Circle object
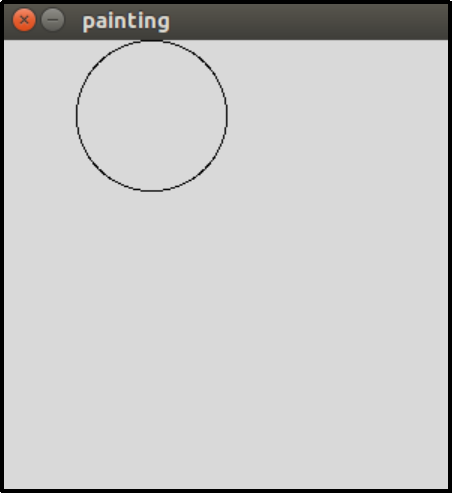
Circle: To create a circle you can use the Circle() method and have a centre at a specific point, pt = Point(50, 50), and a radius of 50. To display the circle on the graphic window use cir.draw(win).
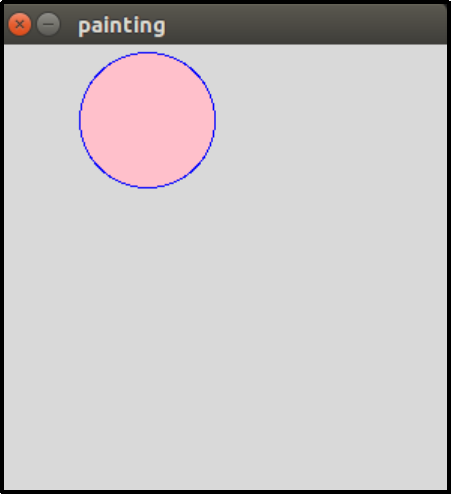
cir = Circle(pt, 50) cir.draw(win)The color of the outline circle is by default black. You can have colors to the outline of the circle as well as within the circle.
For example:
cir.setOutline('blue') cir.setFill('pink')Line Object
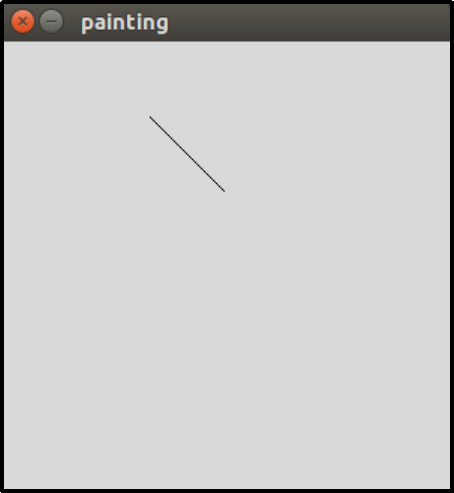
Line: A line is a segment between two points, hence to draw a line you will have to define two points.
For example:
line = Line(Point(100, 50), Point(150, 100)) line.draw(win)Rectangle Object
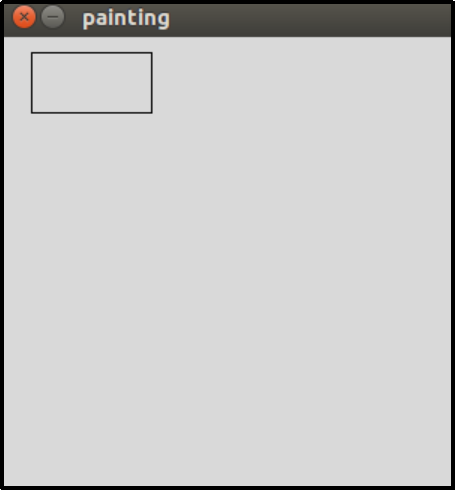
Rectangle: A rectangle is defined using two points and these two points must be diagonally opposite to each other. To display the rectangle on the graphic window use rect.draw(win).
For example:
pt = Point(50, 50) rect = Rectangle(Point (20, 10), pt) rect.draw(win)Oval Object
Oval: You can define an oval shape object by providing two points that determine the bounding box.
For example:
oval = Oval(Point (30, 90), Point (50, 85)) oval.draw(win)Graphics implementation
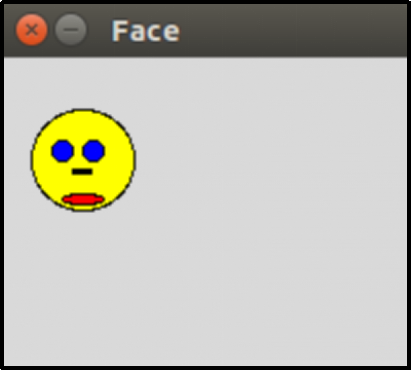
Now, as you learned some basic object implementations. You can use them to create graphics of your choice. Consider an example of creating a human face. For this, you will require a circle, line, and oval object as shown in the following code.
from graphics import * #creating graphic window having name Face and setting the window coordinates win = GraphWin('Face', 200, 150) win.setCoords(0,0,200,150) #creating the face outline using Circle() and painting it with pink color face = Circle(Point(40,100), 25) # set center and radius face.setFill("pink") face.draw(win) #creating the eyes using circles and painting them with blue color eye1 = Circle(Point(30, 105), 5) eye1.setFill('blue') eye1.draw(win) eye2 = Circle(Point(45, 105), 5) eye2.setFill('blue') eye2.draw(win) # Creating the nose using Line() nose = Line(Point(35, 95), Point(45, 95)) nose.setWidth(3) nose.draw(win) # Creating the mouth using Oval() mouth = Oval(Point(30, 84), Point(50, 79)) mouth.setFill("red") mouth.draw(win) win.getMouse() win.close()Face graphics using Python
Likewise, you can create more complex and beautiful graphics using the Graphics module and its methods.
Multiple random objects
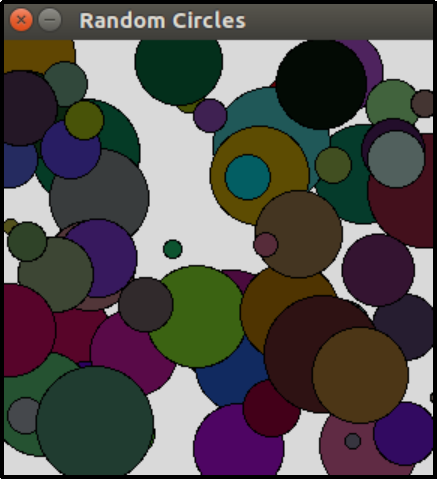
If you ever used Windows OS you might have come across the different color and size circle objects popping on your screen as a screensaver. The Graphic module provides the color_rgb() method to generate random circle objects of different shades of red, blue, and green colors and sizes which can be achieved using randrange() method of the random module.
Example code to create random circle objects:
from graphics import * import random, time win = GraphWin("Random Circles", 300, 300) #creating 75 random circle objects for circle in range(75): #randrange takes one integer argument which defines the intensity of red, blue, and green colors r = random.randrange(100) b = random.randrange(100) g = random.randrange(100) color = color_rgb(r, b, g) #creating circle objects with different radius ranging from 3 to 40 radius = random.randrange(3, 40) x = random.randrange(5, 295) y = random.randrange(5, 295) circle = Circle(Point(x,y), radius) #painting circle objects with different colors circle.setFill(color) circle.draw(win) #time taken for each circle object to appear time.sleep(.05)Although there are a lot of other Python modules like Turtle, Matplotlib, Tkinter, Deep Painterly Harmonization, Bokeh, etc., that helps make awesome graphics, but this module is one of the fastest and has a wide range of methods that allows rendering any graphics with ease.
In this article, you learned about how the graphics module helps you to draw using Python, the basic set of steps required in any type of graphics creation and how to create basic objects.
You can experiment and explore more with these objects and create complex wonderful graphics. The features and functionalities of Graphics are endless and every Python programmers should have a clear idea of how to implement its function and various operations associated with it.
- Python Training Tutorials for Beginners
- Square Root in Python
- Null Object in Python
- TypeError: ‘int’ object is not subscriptable
- Python lowercase
- Python Uppercase
- Python String find
- Python Max() Function
- Invalid literal for int() with base 10 in Python
- Python New 3.6 Features
- Python input()
- Python String Contains
- Install Opencv Python PIP Windows
- Python Print Without Newline
- Id() function in Python
- Attribute Error Python
- Python Combine Lists
- Convert List to String Python
- Remove Punctuation Python
- Python Infinity
