- Debug Java code
- What Is Debugging?
- Examine the code
- Set breakpoints
- Run the program in debug mode
- Analyze the program state
- Step through the program
- Stop the debugger session and rerun the program
- Tutorial: Debug your first Java application
- What Is Debugging?
- Examine the code
- Set breakpoints
- Run the program in debug mode
- Analyze the program state
- Step through the program
- Stop the debugger session and rerun the program
Debug Java code
You have created and run your Java application. Let’s imagine you have discovered that it functions not the way you expected. For example, it returns a wrong value or crashes with an exception. Seems like you have errors in your code, and it’s time to debug it.
What Is Debugging?
Broadly, debugging is the process of detecting and correcting errors in a program.
There are different kinds of errors, which you are going to deal with. Some of them are easy to catch, like syntax errors, because they are taken care of by the compiler. Another easy case is when the error can be quickly identified by looking at the stack trace, which helps you figure out where the error occurred.
However, there are errors which can be very tricky and take really long to find and fix. For example, a subtle logic error, which happened early in the program may not manifest itself until very late, and sometimes it is a real challenge to sort things out.
This is where the debugger is useful. The debugger is a powerful tool, which lets you find bugs a lot faster by providing an insight into the internal operations of a program. This is possible by pausing the execution and analyzing the state of the program by thorough examination of variables and how they are changed line by line. While debugging, you are in full control of the things. In this manual we are covering a basic debugging scenario to get you started.
Examine the code
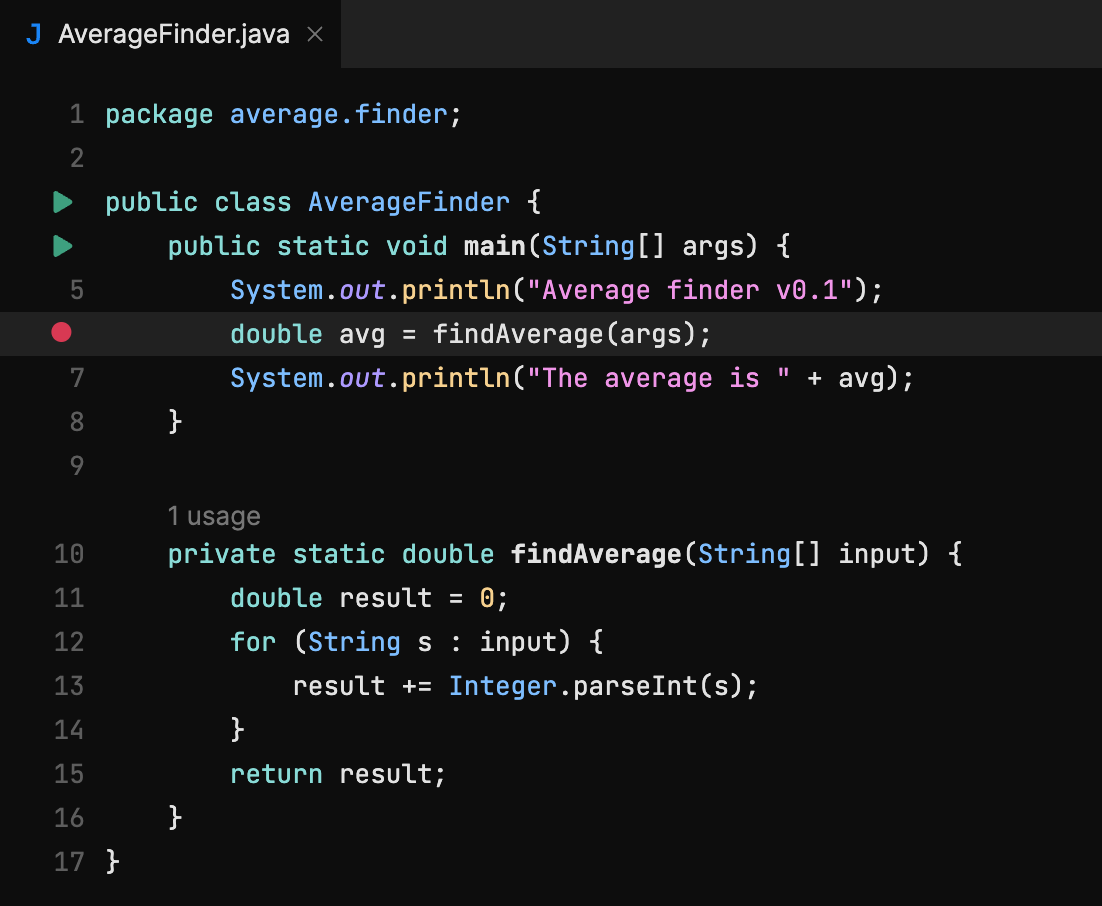
Let’s try a simple debugging case. Imagine we have the following application:
The program is supposed to calculate the average of all values passed as command-line arguments.
It compiles and runs without issues; however, the result is not what one would expect. For instance, when we pass 1 2 3 as the input, the result is 6.0 .
First of all, you need to think about where the suspected error might be coming from. We can assume the problem is not in the print statements. Most likely, unexpected results are coming from our findAverage method. In order to find the cause, let’s examine its behavior in the runtime.
Set breakpoints
To examine how the program operates at runtime, we need to suspend its execution before the suspected piece of code. This is done by setting breakpoints. Breakpoints indicate the lines of code where the program will be suspended for you to examine its state.
- Click the gutter at the line where the findAverage method is called.
Run the program in debug mode
Now let’s start the program in debug mode.
Since we are going to pass arguments for running and debugging the program, make sure the run/debug configuration has these arguments in place.
Press Command R , select the run configuration, and then press Alt ↵ .
Analyze the program state
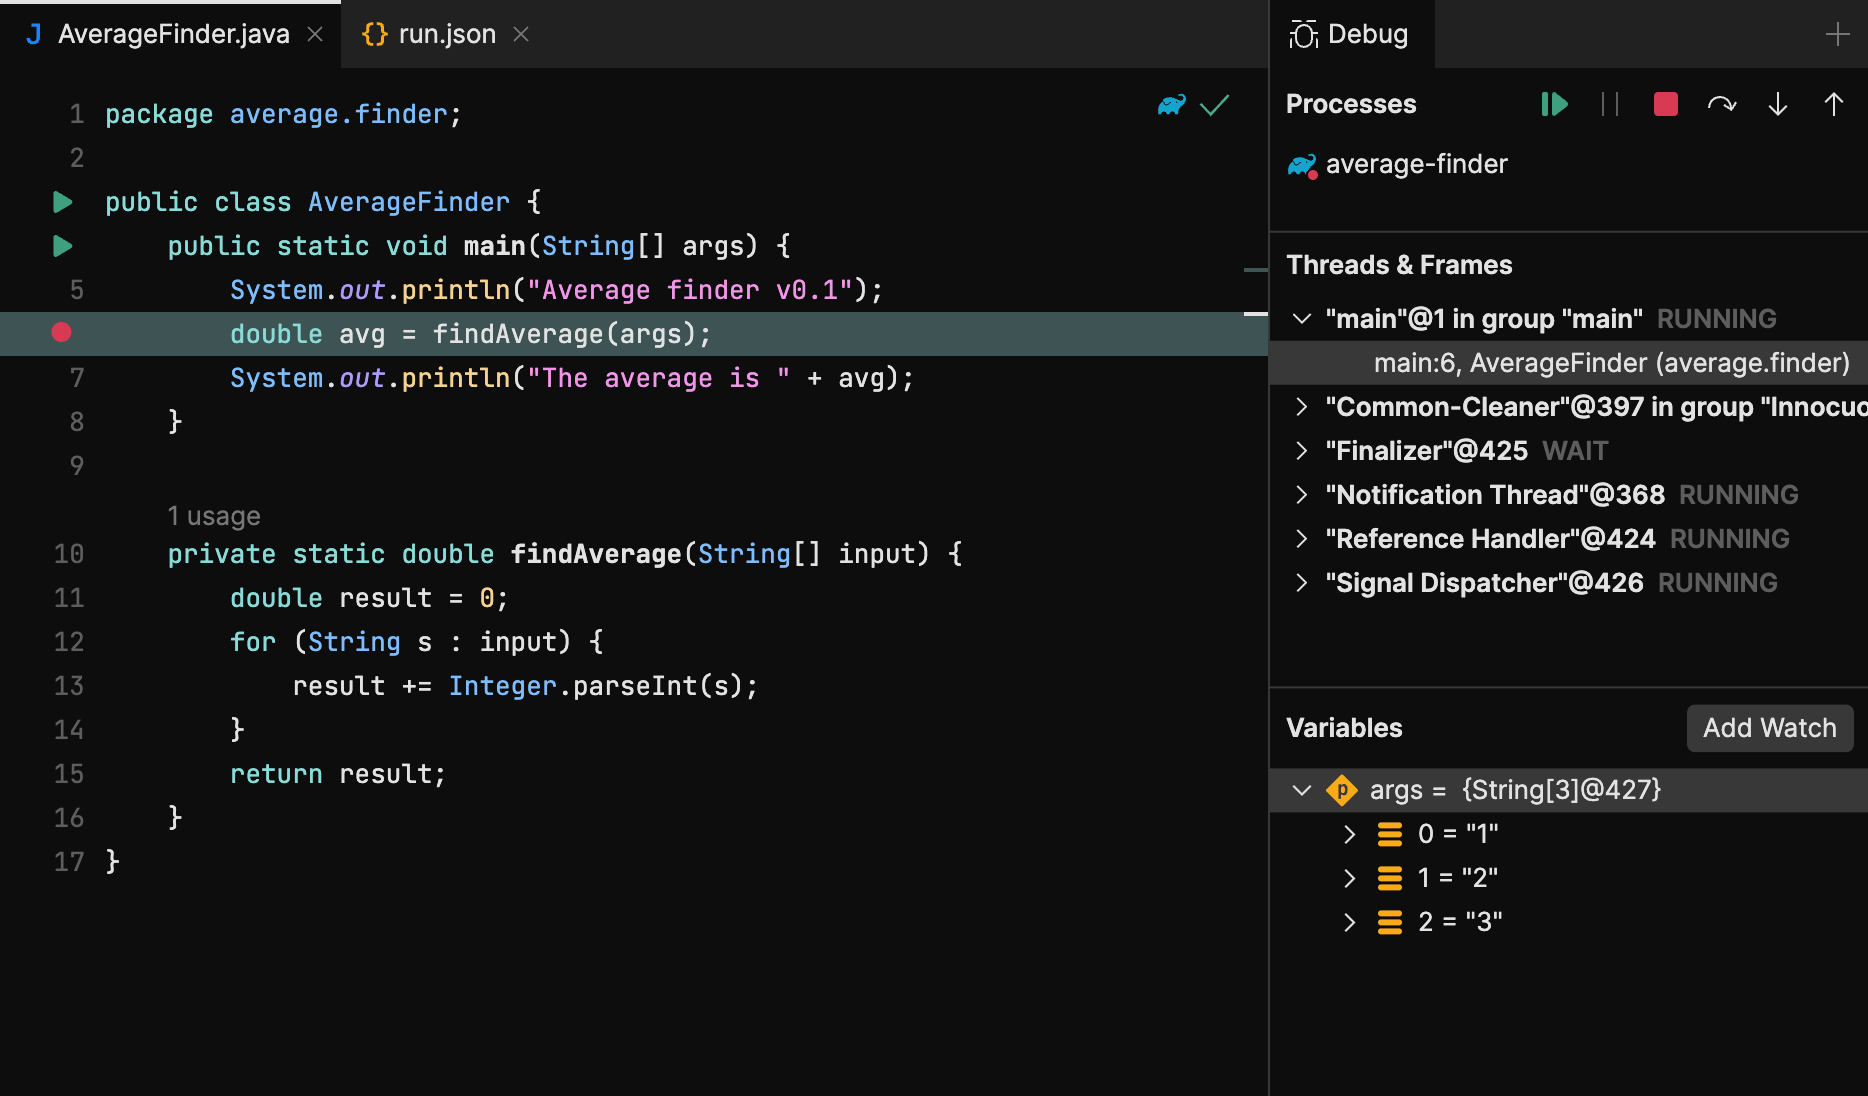
After the debugger session has started, the program runs normally until a breakpoint is hit. When this happens, the line where the program paused gets highlighted and the Debug tool appears.
The highlighted line has not been executed yet. The program now waits for further instructions from you. The suspended state lets you examine variables, which hold the state of the program.
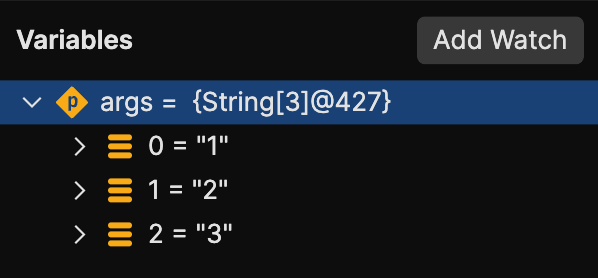
As the findAverage method has not been called yet, all its local variables like result are not yet in scope, however, we can examine the contents of the args array ( args is in scope for the main method). The contents of args are displayed in the Variables panel:
Step through the program
Now that we are comfortable with the Debug tool, it’s time to step into the findAverage method and find out what is happening inside it.
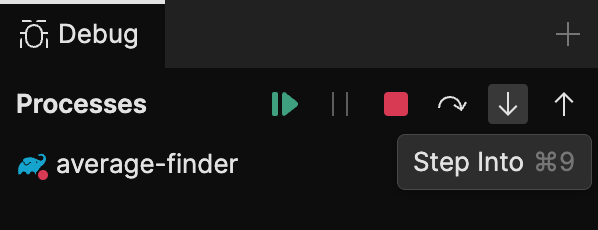
- To step into a method, click the Step Into button or press Command ; .
Another line gets highlighted in the editor because we advanced the execution point one step forward.
- Continue stepping with Step Over Command ‘ . Notice how it is different from Step Into . While it also advances the execution one step forward, it doesn’t visit other methods like Integer.parseInt() along the way. Let’s keep stepping and see how the local variable result is declared and how it is changed with each iteration of the loop.
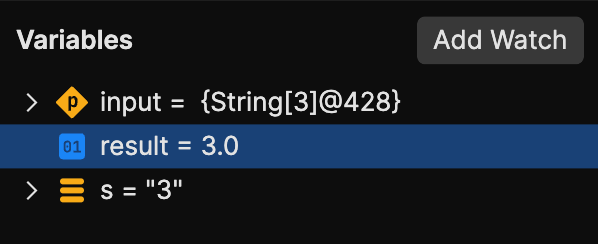
Right now the variable s contains the value «3» . It is going to be converted to int and be added to result , which currently has the value of 3.0 . No errors so far. The sum is calculated correctly.
- Two more steps take us to the return statement, and we see where the omission was. We are returning result , which has the value of 6.0 , without dividing it by the number of inputs. This was the cause of incorrect program output. To continue the program execution after it has been suspended, press Command \ or select Run | Debugging Actions | Resume from the main menu.
- Let’s correct the error:
Stop the debugger session and rerun the program
In order to check that the program works fine, let’s stop the debugger session and rerun the program.
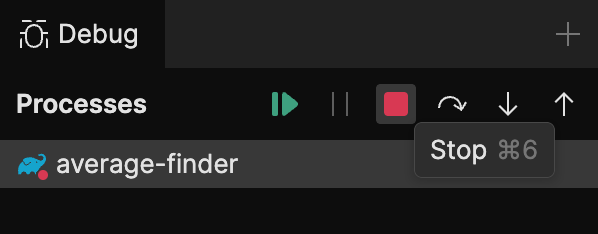
- Click the Stop button or press Command Shift \ .
- Click the Run button near the main method. From the menu, select Run .
- Verify that the program works correctly now.
Tutorial: Debug your first Java application
You have created and run your Java application. Let’s imagine you have discovered that it functions not the way you expected. For example, it returns a wrong value or crashes with an exception. Seems like you have errors in your code, and it’s time to debug it.
What Is Debugging?
Broadly, debugging is the process of detecting and correcting errors in a program.
There are different kinds of errors, which you are going to deal with. Some of them are easy to catch, like syntax errors, because they are taken care of by the compiler. Another easy case is when the error can be quickly identified by looking at the stack trace, which helps you figure out where the error occurred.
However, there are errors which can be very tricky and take really long to find and fix. For example, a subtle logic error, which happened early in the program may not manifest itself until very late, and sometimes it is a real challenge to sort things out.
This is where the debugger is useful. The debugger is a powerful tool, which lets you find bugs a lot faster by providing an insight into the internal operations of a program. This is possible by pausing the execution and analyzing the state of the program by thorough examination of variables and how they are changed line by line. While debugging, you are in full control of the things. In this manual we are covering a basic debugging scenario to get you started.
Examine the code
Let’s try a simple debugging case. Imagine we have the following application:
The program is supposed to calculate the average of all values passed as command-line arguments.
It compiles and runs without issues; however, the result is not what one would expect. For instance, when we pass 1 2 3 as the input, the result is 6.0 .
First of all, you need to think about where the suspected error might be coming from. We can assume the problem is not in the print statements. Most likely, unexpected results are coming from our findAverage method. In order to find the cause, let’s examine its behavior in the runtime.
Set breakpoints
To examine how the program operates at runtime, we need to suspend its execution before the suspected piece of code. This is done by setting breakpoints. Breakpoints indicate the lines of code where the program will be suspended for you to examine its state.
- Click the gutter at the line where the findAverage method is called.
Run the program in debug mode
Now let’s start the program in debug mode.
Since we are going to pass arguments for running and debugging the program, make sure the run/debug configuration has these arguments in place.
- Click the Run icon in the gutter, then select Modify Run Configuration .
- Enter arguments in the Program arguments field.
- Click the Run button near the main method. From the menu, select Debug .
Analyze the program state
After the debugger session has started, the program runs normally until a breakpoint is hit. When this happens, the line where the program paused gets highlighted and the Debug tool window appears.
The highlighted line has not been executed yet. The program now waits for further instructions from you. The suspended state lets you examine variables, which hold the state of the program.
As the findAverage method has not been called yet, all its local variables like result are not yet in scope, however, we can examine the contents of the args array ( args is in scope for the main method). The contents of args are displayed inline where args is used:
You can also get information about all variables that are currently in scope in the Variables panel.
Step through the program
Now that we are comfortable with the Debug tool window, it’s time to step into the findAverage method and find out what is happening inside it.
- To step into a method, click the Step Into button or press F7 .
Another line gets highlighted in the editor because we advanced the execution point one step forward.
- Continue stepping with Step Over F8 . Notice how it is different from Step Into . While it also advances the execution one step forward, it doesn’t visit other methods like Integer.parseInt() along the way. Let’s keep stepping and see how the local variable result is declared and how it is changed with each iteration of the loop.
Right now the variable s contains the value «3» . It is going to be converted to int and be added to result , which currently has the value of 3.0 . No errors so far. The sum is calculated correctly.
- Two more steps take us to the return statement, and we see where the omission was. We are returning result , which has the value of 6.0 , without dividing it by the number of inputs. This was the cause of incorrect program output.
To continue the program execution after it has been suspended, press F9 or select Run | Debugging Actions | Resume from the main menu.
- Let’s correct the error:
Stop the debugger session and rerun the program
In order to check that the program works fine, let’s stop the debugger session and rerun the program.
- Click the Stop button or press Ctrl+F2 .
- Click the Run button near the main method. From the menu, select Run .
- Verify that the program works correctly now.
