- WSL2 and remote debugging
- Intro
- WSL2
- Xdebug and VSCode
- Dynamic IP for WSL2 — Windows10 network bridge
- Windows Defender and XDebug sockets
- Dev workstation side (VS Code on windows10)
- Listening on the external public IP
- Asset and Assets
- Setup php on wsl with vscode
- VS Code
- Linter
- Debug
- Install XDebug on WSL
- php.ini
- Browser window?
- PHP Errors
- Logging
- Formatting
- VSCode & PHP XDebug from Localhost, WSL2 and Docker containers
WSL2 and remote debugging
How to setup PHP server (nextcloud) or python server or node js on WSL2 inside Windows10 (Build 18980) with remote debugging on VS Code using Extensions.
For ex: PHP Debug 1.13.0 extension is the XDebug adapter inside VSCode
Intro
WSL2
Windows Subsystem for Linux is aimed to be a Linux (POSIX like runtime environment inside Windows10) In WSL1 it is a redirection of OS calls to underlying OS In WSL2 it is a Linux kernel , acting a VM inside hosting OS (W10) , localhost on Win10 redirects on the internal VNET address
Xdebug and VSCode
Please refer to this post on Nextcloud Debugging
Dynamic IP for WSL2 — Windows10 network bridge
to connect to the Windows hosted (inside VS Code) XDebug server , PHP server (php-fpm10) must contact the hosting windows. The IP is the nameserver inside /etc/resolv.conf
gui@SAGIS-09:~$ cat /etc/resolv.conf # This file was automatically generated by WSL. To stop automatic generation of this file, add the following entry to /etc/wsl.conf: # [network] # generateResolvConf = false nameserver 172.20.0.1 By default with a untouched php.ini setup , the log contains:
[11583] Log closed at 2019-09-17 14:54:46 [11583] E: Could not connect to client. :-( [11583] W: Creating socket for '0.0.0.0:9009', poll success, but error: Operation now in progress (29). [11583] I: Connecting to configured address/port: 0.0.0.0:9009. [11583] Log opened at 2019-09-17 14:54:46 The solution is to configure php-fpm to get xdebug listening on bridge IP / windows side instead on localhost
gui@SAGIS-09:/$ sudo vi /etc/php/7.3/fpm/php.ini . [xdebug] zend_extension="/usr/lib/php/20180731/xdebug.so" xdebug.remote_enable=1 xdebug.remote_autostart=1 xdebug.remote_handler=dbgp xdebug.remote_port=9009 xdebug.remote_host=172.20.0.1 xdebug.remote_log = /var/log/xdebug.log Windows Defender and XDebug sockets
It could be mandatory to open firewall on windows 10
[11682] Log closed at 2019-09-17 14:57:03 [11682] E: Time-out connecting to client (Waited: 200 ms). :-( [11678] I: Connecting to configured address/port: 172.20.0.1:9009. [11678] Log opened at 2019-09-17 14:57:01 It is possible due to Firewall blocking VS Code , Xdebug server. So authorize program: code.exe to listen into Private
For other IDE , it could be time-saving to know what is the program:
Powershell command gives the Program listening on port 9009
Get-Process -Id (Get-NetTCPConnection -LocalPort 9009).OwningProcess Dev workstation side (VS Code on windows10)
Because WSL2 is boxed, XDebug inside VS Code must listen on 0.0.0.0 instead of default localhost. https://docs.microsoft.com/en-us/windows/wsl/wsl2-ux-changes#other-networking-considerations Open the configurations on DEBUG / PHP (the launch.json file)
// Use IntelliSense to learn about possible attributes. // Hover to view descriptions of existing attributes. // For more information, visit: https://go.microsoft.com/fwlink/?linkid=830387 "version": "0.2.0", "configurations": [ "name": "Listen for XDebug", "type": "php", "request": "launch", "hostname": "0.0.0.0", "port": 9009, // server -> local "pathMappings": "/var/www/html": "$/www", // "/app": "$/app", "/home/gui/nc": "$", "/apps": "$/apps", "/custom_apps": "$/custom_apps" > >, "name": "Launch currently open script", "type": "php", "request": "launch", "program": "$", "cwd": "$", "hostname": "0.0.0.0", "port": 9009 > ] > Listening on the external public IP
PORT RELAY / PROXY of Windows 10 on WSL2 (internal VNET)
A server listening inside WLS2 could be accessed by localhost on Win10. https://localhost would bridge to the dynamic VNET IP address inside WSL2.
For being able to redirect external IP to this internal dynamic VNET IP address, Win10 provides Port Proxy :
netsh interface portproxy add v4tov4 listenaddress= listenport=80 connectaddress=localhost connectport=80 netsh interface portproxy show all Écouter sur ipv4 : Connecter à ipv4 : Adresse Port Adresse Port --------------- ---------- --------------- ---------- 80 localhost 80 netsh interface portproxy delete v4tov4 listenaddress= listenport=9000 Asset and Assets
Software | Computing | Project | Software | Engineer | Architecture | Innovation | Systems Integration | Continuous Integration | Continuous Deployment | Continuous Delivery | Agile | Devops | C++ | C# | Java | Scala | Python | MultiThreading | Design Pattern | Commmando | Rapid Application Development | Regulatory Reporting | Transaction Reporting | RTS25 | MIFID2 | MIFID II | MIF2 | Solvency 2 | Sol2 | Basel III | US GAAP | IFRS Stock | Equity | Fixed Income | Asset Management | Swap | Interest Rate | Forex | Trading | Pricing | PTP | NTP | Clock Synchronization | Low Latency | GPS | Derivative | Option | Future | American style Option | European style Option | Market Data | Benchmark | Index | Indexes Asset Reallocation | Rebalancing | Drill Drown | Financial engineer | Risk Management | Delta | Alpha | Beta | Greeks| Tracking Error | VaR | Value at Risk | FRTB | expected shortfall | Stress Testing | Performance | Attribution | Allocation | Selection | Stock Picking | Total return | Scoring | CFA | AMF | ECB | Global Association of Risk Professionals | GARP |
Setup php on wsl with vscode
To get PHP installed on my WSL2 instance running Ubuntu 20.04.3 and code editing from VS Code on Windows side:
sudo apt install php7.4 php7.4-curl php7.4-xml php7.4-zip php7.4-mbstring php7.4-gd php7.4-xdebug sudo apt install php7.4-dev VS Code
Remote — WSL open any folder in WSL, which I already had installed
Linter
VSCode Preferences, Settings. Search for PHP settings (there are some linters ready to go — need path for php). I’ve not set these up.
Debug
did a phpinfo(); and ran debug in VSCode
Install XDebug on WSL
wget tar -xvzf xdebug-3.1.5.tgz ## had all the extensions I needed tar -xvzf xdebug-3.1.5.tgz cd xdebug-3.1.5 phpize ./configure make sudo cp modules/xdebug.so /usr/lib/php/20190902 ## zend_extension = xdebug sudo vim /etc/php/7.4/cli/conf.d/20-xdebug.ini php.ini
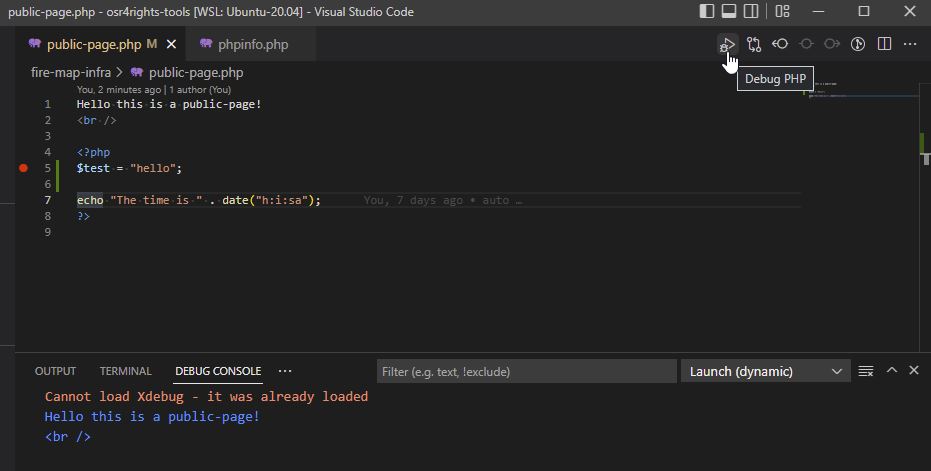
Note — the error Cannot load Xdebug — it was already loaded was due to me adding extra lines a the bottom of php.ini which I didn’t need:
php.ini in /etc/php/7.4/cli and also in /etc/php/7.4/apache
# didn't need these added to bottom of php.ini zend_extension="/usr/lib/php/20190902/xdebug.so" xdebug.mode = debug xdebug.start_with_request = yes Browser window?
I can get a debug console working, but expected a browser window to work, which hasn’t so far.
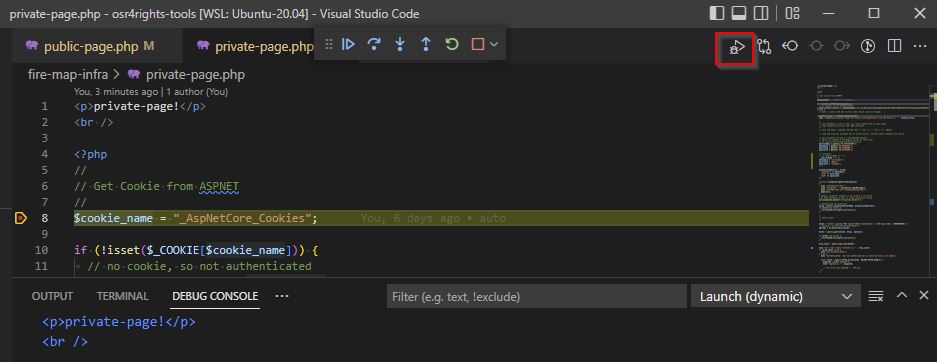
F5 doesn’t seem to start debugging, but the icon does. Error has gone away as I took out the php.ini settings.
PHP Errors
I got enough working to debug my issue. https://www.cloudways.com/blog/php-debug/ contains deeper debugging.
Logging
Rudimentary logging to say the least, but it works out of the box 🙂
// shows up in /var/log/apache2/error.log error_log('Your message here'); Formatting
echo "hello"; // apparently best practise to not do a php closing tag anymore // end of file - Contractor, freelancer, SaaS business owner, conference speaker, dad, rock climber and passionate about people and technology
dave_mateer
VSCode & PHP XDebug from Localhost, WSL2 and Docker containers
![]()
VSCode seems to be one of the up and coming IDEs over the last year. I personally switched from Jetbrains IDEs to VSCode fo most of my development work at some point in 2020.
Apparently up until now I have avoided running the PHP debugger Xdebug. I had to do a little search around to figure out the correct settings for my setup decided to write them down in this handy blog post.

VSCode doesn’t come with support for PHP Xdebug built in, so you need to add an extension. You probably want to download the one called “PHP Debug” with the most downloads (currently at 4.2 million).

At the time of writing this the PHP Xdebug extension will provide three default snippets of debug configuration that might be useful. “Launch build-in server”, “Launch current script in console” and “Listen for Xdebug”. These will be useful if your simply running php on the same machine as VSCode.

Each configuration can be activated using the dropdown menu at the top of the debug panel. Just select the correct configuration and hit the play button.

This will start the debug client and load some more controls into another UI element. These buttons allow step through, over, into, restart and stop.
Local defaults / Same host
The default config for listening for Xdebug will work in most situations. This includes running all of this on localhost, OR running VSCode and PHP in WSL2.
< "name": "Listen for Xdebug Remote", "type": "php", "request": "launch", "port": 9000, >Code language: JSON / JSON with Comments (json) 
Make sure VSCode is listening for connections, and that you have a script with a breakpoint in it ready to run.
Then on the same host as VSCode you could then run the following to trigger a connection to the debug client. (Remember, you’ll need a breakpoint in a file to see it stop).
XDEBUG_CONFIG="client_port=9000 client_host=localhost remote_enable=1" php test.phpCode language: JavaScript (javascript)Debugging from docker containers can require a little more effort and will also differ between setups (Especially if using WLS2). In some setups the above localhost solution may already work for you!
VSCode will require you to add a hostname field to the debug configuration. This can be added for all cases as it will not stop local listens from working.
The hostname needs to be set to either localhost or 0.0.0.0
< "name": "Listen for Xdebug Remote", "type": "php", "request": "launch", "port": 9000, "hostname": 0.0.0.0, >Code language: JSON / JSON with Comments (json) If you are running docker on the same host as VSCode, then you should be able to trigger debug connections with the following (If you’re system supports host.docker.internal ):
XDEBUG_CONFIG="client_port=9000 client_host=host.docker.internal remote_enable=1" php test.phpCode language: JavaScript (javascript)If you want a quick image to test this in I can recommend webdevops/php-dev .
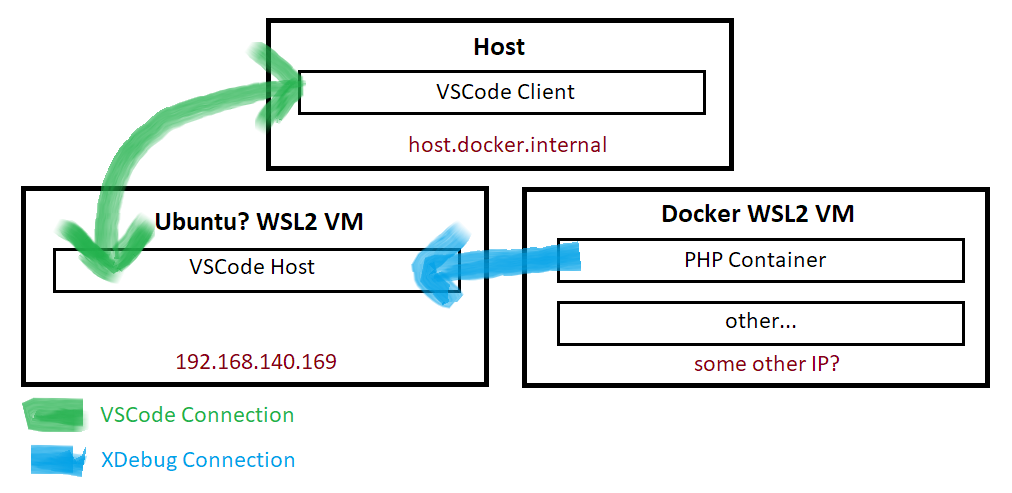
If you are NOT running VSCode on the same host, which will be the case if you are running VSCode in WSL2 mode on Windows, then currently you seem to need to specify the IP address of the WSL2 VM for the client_host .
You can get the WSL2 IP address used by VSCode by using ifconfig or by checking the log within VSCode which you can find with Remote-WSL: Show Log
If you’re using some other remote setup then you just need the IP address of your VSCode instance, as visible from wherever you’re running you’re code.
XDEBUG_CONFIG="client_port=9000 client_host=192.168.140.169 remote_enable=1" php test.phpCode language: JavaScript (javascript)Illustrating exactly what is happening here: