- Debugging Java Memory issues: Thread and Heap Dump Analysis
- Working with Java Heap Dumps
- Collecting Heap Dumps
- Analysing Heap Dumps
- Using Eclipse MAT
- Other Alternative Heap Dump Analysis Tools
- Working with Thread Dumps
- Collecting Thread Dumps
- Identifying threads consuming high CPU
- Debugging Garbage Collection issues
- Garbage Collection logs
- Java Heap Dump Analyzer
- Overview
- What Is Heap?
- Garbage Collection
- OutOfMemory
- How to Take Heap Dump
- Eclipse Memory Analyzer
- Sample Application for Testing
- References
Debugging Java Memory issues: Thread and Heap Dump Analysis
Java has garbage collection (GC) feature which automatically handles memory management for us — determines what memory is no longer being used by a Java application, destroying/deallocation the unused objects and reclaiming the runtime unused memory for reuse.
Even though GC makes Java memory-efficient, we often fall prey to crippling memory leaks which impacts the software performance in unpredictable ways and can even bring down an entire system. Monitoring the JVM’s GC activity with Memory & Heap usage and collecting the Thread/Heap Dumps when required can help identify and root cause common Java memory issues.
Usually, memory leaks show up as OutOfMemoryError (OOM), but not necessarily always. For example, if the Heap size is too small and if the applcation is trying to allocate memory for new objects but it breached the max heap size configured, the error would look like:
java.lang.OutOfMemoryError: Java heap space Working with Java Heap Dumps
Java uses the heap as the storage for Java objects. Collecting and analysing the Heap Dumps is great way to identify and root cause lot of memory related issues.
Collecting Heap Dumps
- Automatically on OutOfMemoryError
- If the Java application is configured the VM flag -XX:+HeapDumpOnOutOfMemoryError , then a heap dump is collected on the first OOM Error. Note that there will not be any overhead involved unless an OOM actually occurs, so it’s recommended to enable this for all production systems which can be handy if and when any memory issue comes.
- It’s important to note that the dump file can be huge, up to Gigabytes, so ensure that the target file system has enough space. If the application hits OOM Error frequently and is creating Heap dumps often, the disk space might run out of space soon causing many more cascading issues!
- On-demand via jmap utility (OracleJDK/OpenJDK HotSpot)
- In the Java bin directory, you can use jmap utility to get a live heap dump and/or dump the heap on OOM with a JVM argument.
- Find the ProcessId (PID) for the Java application by running ps aux | grep java .
- Run below jmap command to generate the Heap dump for given process with PID with given .
jmap -F -dump:format=b,file=.hprof
Analysing Heap Dumps
The Heap Dumps collected are not readable directly. After collecting the Heap Dump, we would need to parse the Heap Dump file for analysis to produce a readable and easy-to-understand report.
An Analyzer can help to quickly calculate the retained sizes of objects, see who/what is preventing the Garbage Collector from collecting objects and identify memory leak suspects.
There are multiple Analyzer tools available to do this — Eclipse MAT is one such tool.
Using Eclipse MAT
Eclipse Memory Analyzer (MAT) is a fast and feature-rich Java heap analyzer that helps you find memory leaks and reduce memory consumption.
To analyse Heap Dumps (even very large ones) using Eclipse MAT, you can follow below steps:
- Install JDK11 (or newer)
- If you have Homebrew and would like to install Amazon Corretto (free OpenJDK distribution), you can run brew tap homebrew/cask-versions && brew install —cask corretto .
- To verify the installation if on MacOS, run /usr/libexec/java_home -V . This will print out the directory path to which the JDK is installed to.
- Install Eclipse MAT
- Install Eclipse MAT by following the Official Installation guide
- Assuming Eclipse MAT is installed and we are inside the mat/ directory, modify MemoryAnalyzer.ini file settings to use a large heap to handle large dumps and add the Java bin path to vm option.
- Here, Xms specifies the minimum Heap memory and Xmx specifies the maximum.
- Reference wiki for configuring VM options
-vm /usr/lib/jvm/java-11-amazon-corretto.x86_64/bin/java -startup plugins/org.eclipse.equinox.launcher_1.6.200.v20210416-2027.jar --launcher.library plugins/org.eclipse.equinox.launcher.gtk.linux.x86_64_1.2.200.v20210429-1609 -vmargs -Xms24g -Xmx24g ./ParseHeapDump.sh /tmp/jvm.hprof ./ParseHeapDump.sh /tmp/jvm.hprof org.eclipse.mat.api:suspects Other Alternative Heap Dump Analysis Tools
- VisualVM : A GUI Java profiling/analysis tool that can be used for Performance profiling (including per-thread analysis), Thread/Heap dumping, Monitoring.
- For JDK 8, this comes bundled as jvisualvm . For JDK 9, you will need to manually download it.
Working with Thread Dumps
A thread dump is a snapshot of the state of all the threads of a Java application process.
A thread dump can be very useful for diagnosing/debugging problems related to threads, like high CPU usage etc.Collecting Thread Dumps
Java JDK provides multiple tools for capturing the thread dump of a Java application which are located under the bin folder inside the JDK home directory.
One such tool is jstack which can be used by following below steps:- Find the ProcessId (PID) for the Java application by running ps aux | grep java .
- Run jstack with given PID and given FileName (like /tmp/thread_dump_1.txt ).
jstack -l > /tmp/thread_dump_1.txtIdentifying threads consuming high CPU
- Capture the Thread dump of the Java applcation using above steps (if not done already).
- Find the processId (PID) for the application by running ps aux | grep java .
- Identify the threadIds consuming high CPU for the given processId PID from previous step.
Debugging Garbage Collection issues
Garbage Collection logs
The Garbage Collection logs can record memory usage information and garbage collection related performance metrics (throughput, accumulated pauses, longest pause, etc.) that can be analyzed using tools like GCViewer.
Enabling GC logs in our software systems can come in handy when things go wrong incase issues like Memory leaks.Below are some common JVM flags used for Garbage Collection logging in Java 8. Refer to https://www.baeldung.com/java-gc-logging-to-file for more info.
"-XX:+PrintGCDetails" "-XX:+PrintGCDateStamps" "-XX:+PrintTenuringDistribution" "-XX:+PrintClassHistogram" "-Xloggc:gc_log_file.log"Java Heap Dump Analyzer
Join the DZone community and get the full member experience.
Overview
Identifying the reason for an OutOfMemory error in Java applications with a larger heap size is a nightmare for a developer, because most of the OutOfMemory situations may not be identified during the testing phase. It may occur only in production after running for a long time. The purpose of this article is to explain the use of a heap analyzer tool to identify a memory leakage in larger enterprise Java applications, which use a larger size of heaps. Before going to the details, we will discuss the following points:
What Is Heap?
The space used by the Java Runtime to allocate memory to Objects and JRE Classes is called Heap. The heap space can be configured using the following JVM arguments:
The maximum heap size that can be configured in a 32 bit JVM is 2GB. If any application requires more than 2 GB, it should run on 64 bit JVM. 64MB is the maximum heap size by default.
Garbage Collection
One of the advantages of Java over C++ is automatic memory management. In C++, memory can be released manually, but it will happen automatically in Java using a process called garbage collection. Garbage collection will free up the memory of an object that doesn’t have any reference; it will destroy unused objects. The garbage collection process can be tuned for different applications based on the object creation characteristics of the application. This can be achieved through a number of JVM arguments. Following are a few JVM arguments which can be used to tune the garbage collection process:
Description
Use parallel garbage collection for scavenges.
Use parallel garbage collection for the full collections. Enabling this option automatically sets -XX:+UseParallelGC.
Ratio of old/new generation sizes. The default value is 2.
Ratio of eden/survivor space size. The default value is 8.
Sets the number of threads used during parallel phases of the garbage collectors. The default value varies with the platform on which the JVM is running
GC Execution has a direct relationship with the size of the Heap.
- Larger Heap size will increase the GC execution time, but decrease the number of GC executions.
- Smaller Heap Size will increase the number of GC executions, but decrease the GC execution time
OutOfMemory
A java.lang.OutOfMemoryError will occur when the application tries to add more objects into the heap and there is no space left. This will happen when the maximum heap size set in the start of the application is filled with objects and the garbage collector is not able to free up the memory because the all objects in heap still have some references. This may happen because of two reasons:
- The application may need more memory to run; the currently allocated heap size is not enough to accommodate the objects generated during the runtime.
- Due to a coding error in the application which is keeping the references of unwanted objects.
The solution for the first reason is to increase the heap size. The solution for the second is to analyze the code flow and heap dump to identify the unwanted objects in heap. To analyze the application heap, we need to take the heap dump and open it in a memory analyzing tool.
In this article, we will discuss on how to take the heap dump of an application running on Oracle Java and analyze it in Eclipse Memory Analyzer.
How to Take Heap Dump
Heap dump can be taken in two ways:
- A JVM argument can be added to generate heap dump whenever an OutOfMemoryError occurs.
- The -XX:+HeapDumpOnOutOfMemoryError option can be added to generate a heap dump on OutOfMemoryError. By default, the heap dump is created in a file called java_pid pid .hprof in the working directory of the VM, but we can set an alternative path using the JVM option -XX:HeapDumpPath=path .
- Using a jmap tool available with JDK. The following command can be executed from the command line:
- jmap -dump:format=b,file=heap.bin «» can be replaced with the process id of the application.
Eclipse Memory Analyzer
Eclipse Memory Analyzer can download from eclipse.org.
Unzip the downloaded file and double click «MemoryAnalyzer» to start the application.
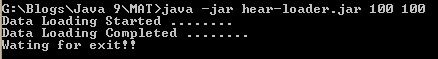
Execute a Java program which is continuously running.

Take heap dump using jmap:
jmap -dump:format=b,file=heap.bin 6920

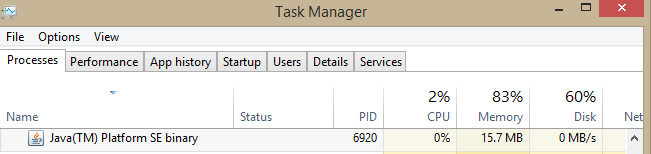
Identify the process id of the running application in Windows from the Task Manager.

In Linux, to identify the process id, use ps –ef | grep java .
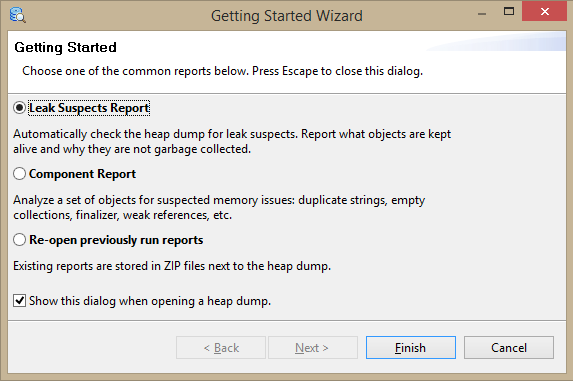
Open the heap dump in Eclipse Memory Analyzer using the option File —> Open Heap Dump.
First, it will prompt you to create a leak suspect report. The user can create it or skip it.

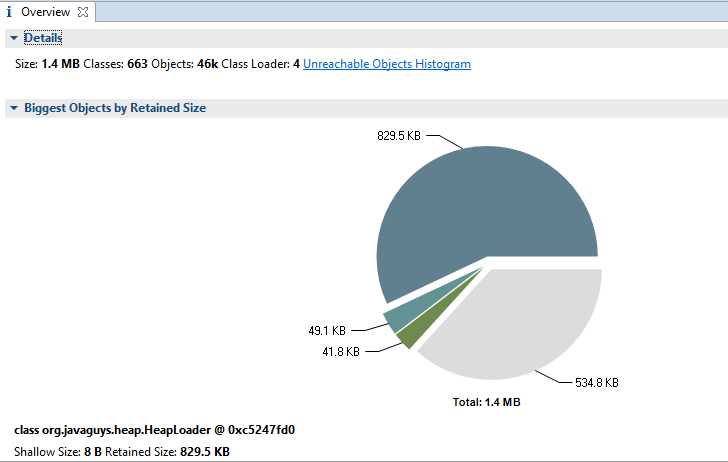
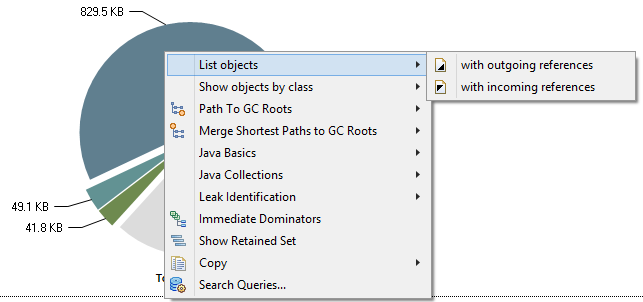
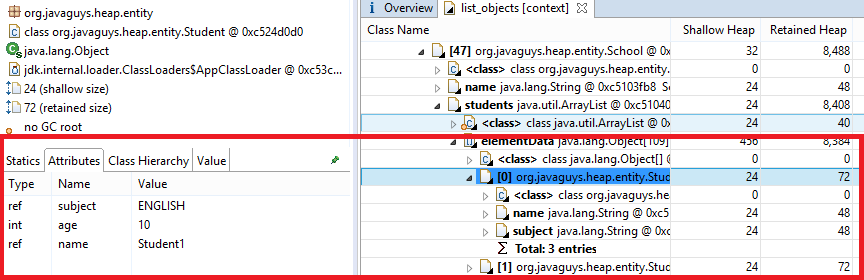
The «overview» tab of the memory analyzer will show the total size of the heap and a pie chart of object size.

Click on the highest value in the pie chart and select List Objects —> with outgoing references.
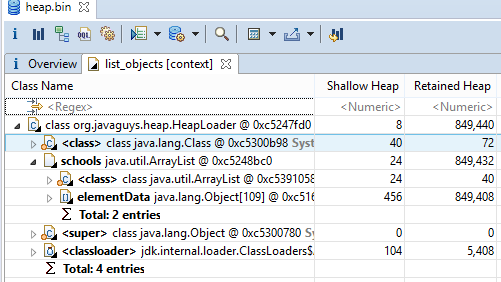
It will open a new tab, «List Objects,» and expand the tree structure of the object.
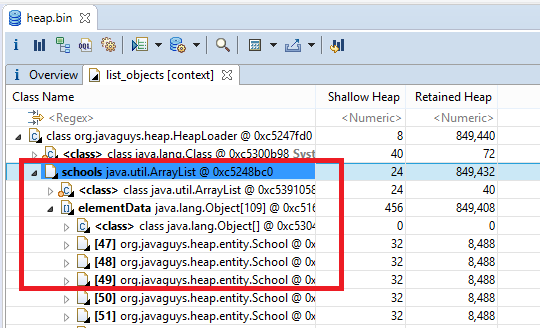
The user can expand and find the objects available in heap. In this example, the HeapLoader object consist of a list of School objects, and school objects consist of a list of students.
School List in HeapLoader

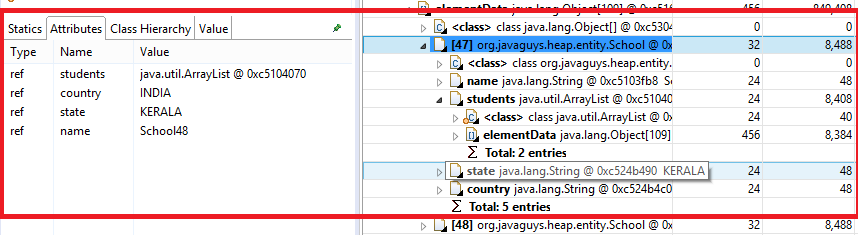
Each school object in List and its attributes

Student object in school and its attribute

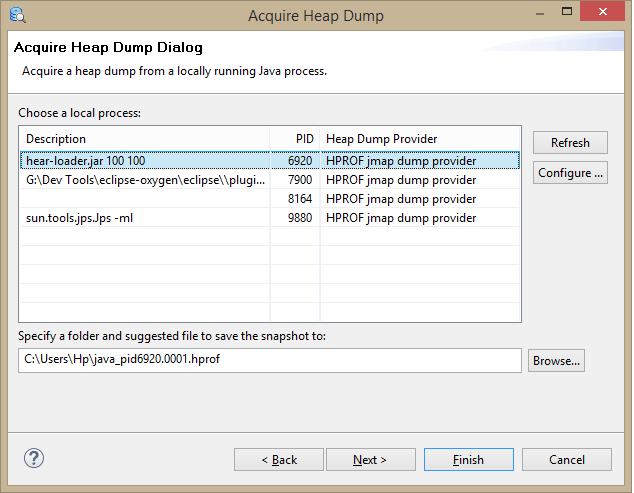
There is an option available in Eclipse Memory Analyzer to Acquire Heap Dump if the application is running on the same machine. SelectFile —> Acquire Heap Dump to show all Java applications available on the machine. Select the process, browse the path where you want the heap to save. and click «finish.»
These are the basic steps to analyze a heap dump. There are more options available in Memory Analyzer, which will give more insight into the heap dump. Eclipse Heap Analyzer can be used for the dumps generated from an application running on Oracle Java.
Sample Application for Testing
The sample application used in the above example consists of two objects, School and Student. Details about the sample application are available here.
References
garbage collection Java (programming language) Dump (program) application Object (computer science) Memory (storage engine) Dump analyzer Garbage (computer science) Java virtual machine Eclipse
Published at DZone with permission of Sudeep C M . See the original article here.
Opinions expressed by DZone contributors are their own.